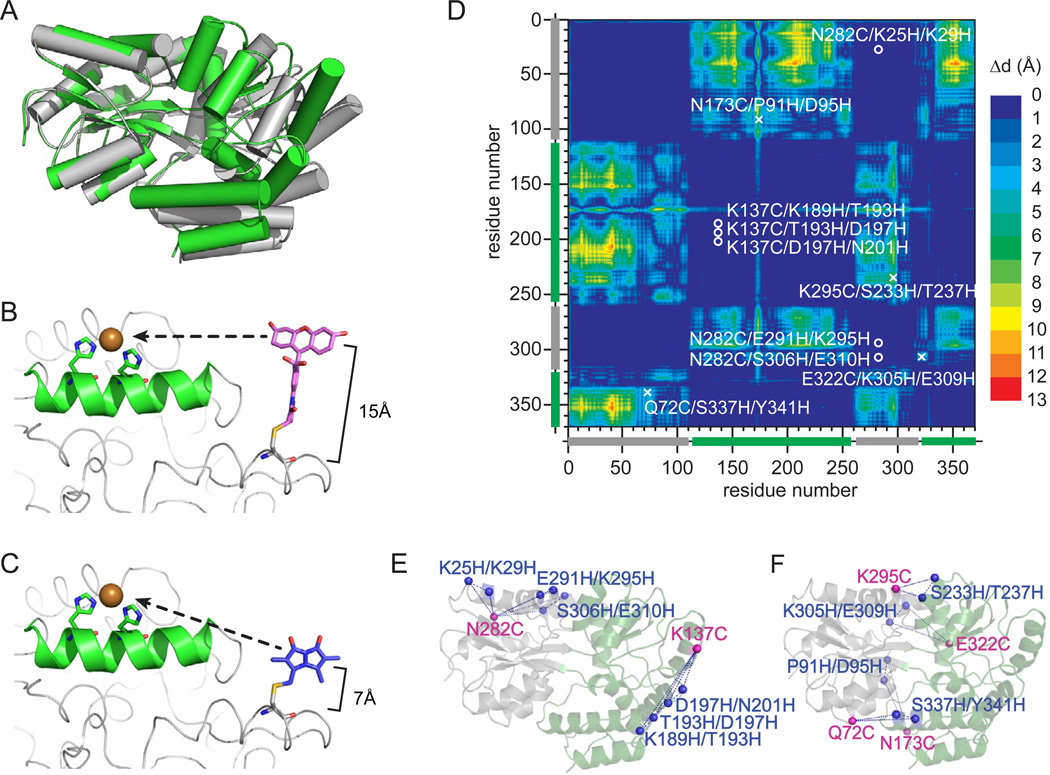
Figure 1.
Mapping the structure of MBP with tmFRET. a) The x-ray crystal structures of MBP in the APO (grey, protein data bank:1OMP) and HOLO (green, protein data bank:3MBP) states. b) Model of bi-functional labeleing of a single protein with a cysteine-linked dye fluoresceine-5-maleimide and a di-histidine coordinated metal ion or (c) cysteine-linked mono-bromobimane and a di-histidine coordinated metal ion. d) Dynamic distance map comparing the HOLO and APO state crystal structure of MBP. The colormap shows the amino acid to amino acid difference in distance between each state of the protein. The location of the chosen label sites are indicated as a circle (fixed pair) or an x (dynamic pair). d) Cartoon of the label sites in MBP. The pairs that map fixed disances are shown on the left and pairs that map dynamic distances are shown on the right.

