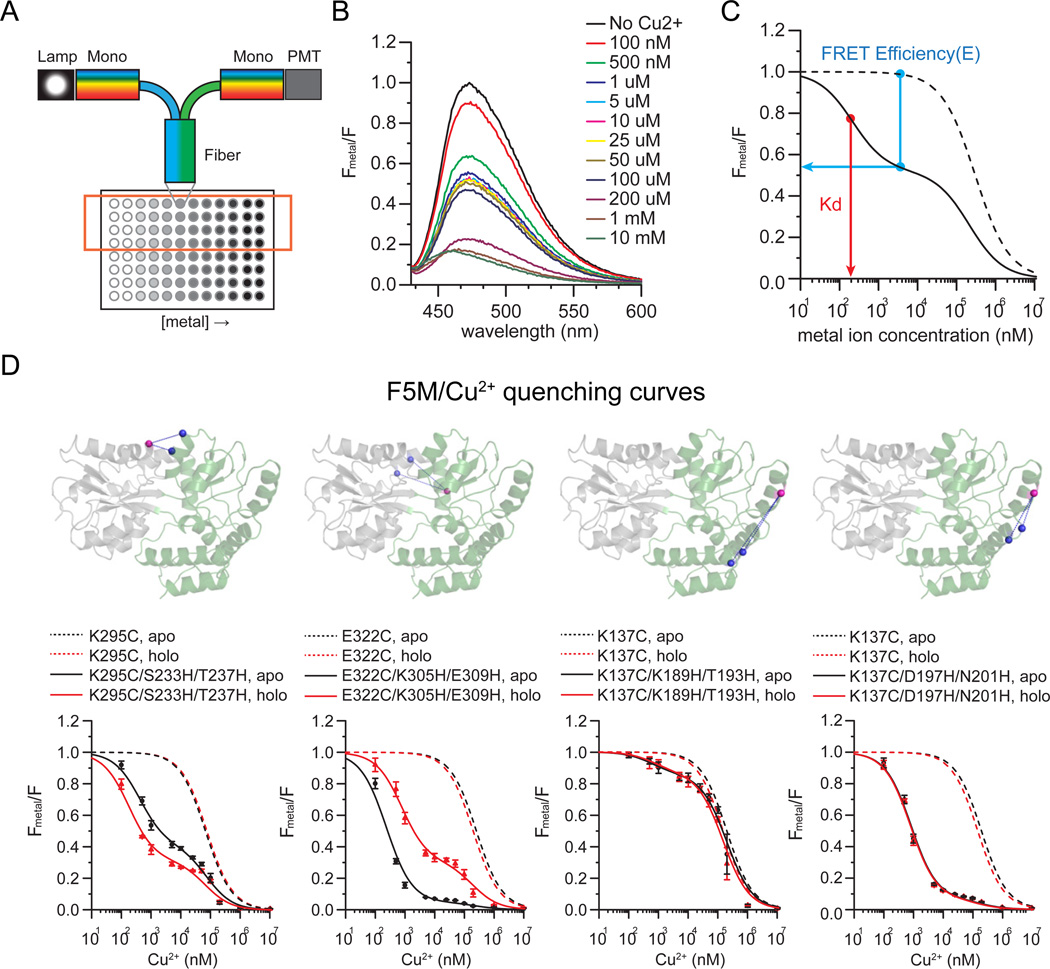
Figure 2.
tmFRET measurements of MBP. a) Cartoon of the experimental system. Fluorescence was measured in a 96 well plate through a fiber-optic launched fluorometer. Increasing concentrations of metal were added to a constant concentration of protein. b) Spectra were collected from each well and the quantity of quenching was measured. c) For analysis, spectra were normalized to the initial value at zero metal and the relative fluorescence from a di-histidine containing mutant (solid trace) was plotted as a function of metal concentration. All constructs were compared to cysteine-only controls (dotted lines). From these traces, FRET efficiencies and Kd could be determined. d) Representative quenching curves for di-histidine-containing MBP mutants (4 out of 10 are shown) compared to cysteine only controls. Spectra were collected for MBP in the absence (APO, black line) and presence (HOLO, red line) of maltose.

