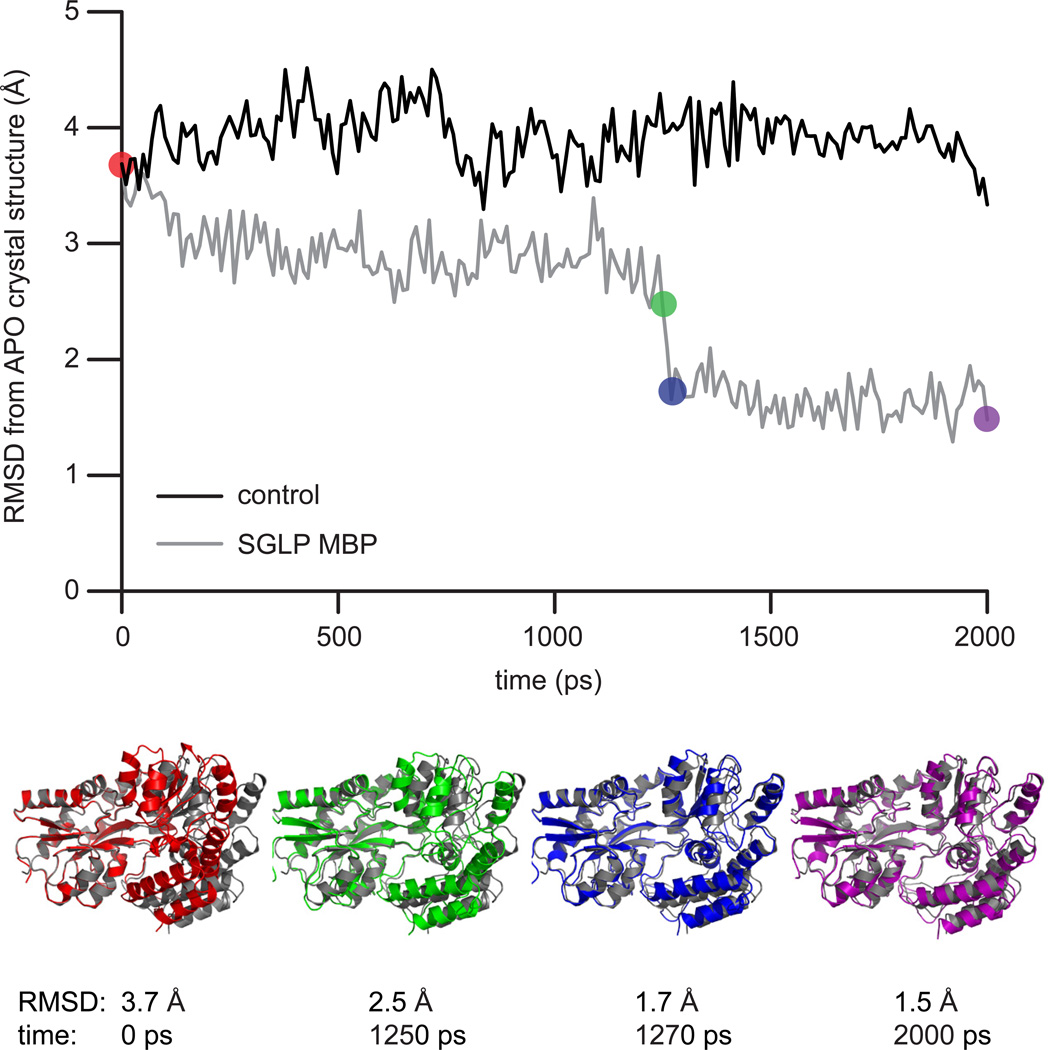
Figure 4.
Using tmFRET distances to guide molecular simulations. a) Self-guided Langevin dynamics simulations of MBP starting in the HOLO state (PDB: 3MBP). Plot compares the RMSD during the simulation between the simulation conformation and the APO state crystal structure of MBP (PDB: 1OMP). After 2 ns of simulation, MBP does not find the APO state (black trace). With tmFRET-derived distance constraints added to the simulation, the simulation adopts the APO state within 2 ns (grey trace). Representative structures from the tmFRET-constrained simulation are shown below. The color of the simulated strucures match time-points on the graph. As a comparision, the grey structure is the APO state crystal structure.

