FIGURE 4.
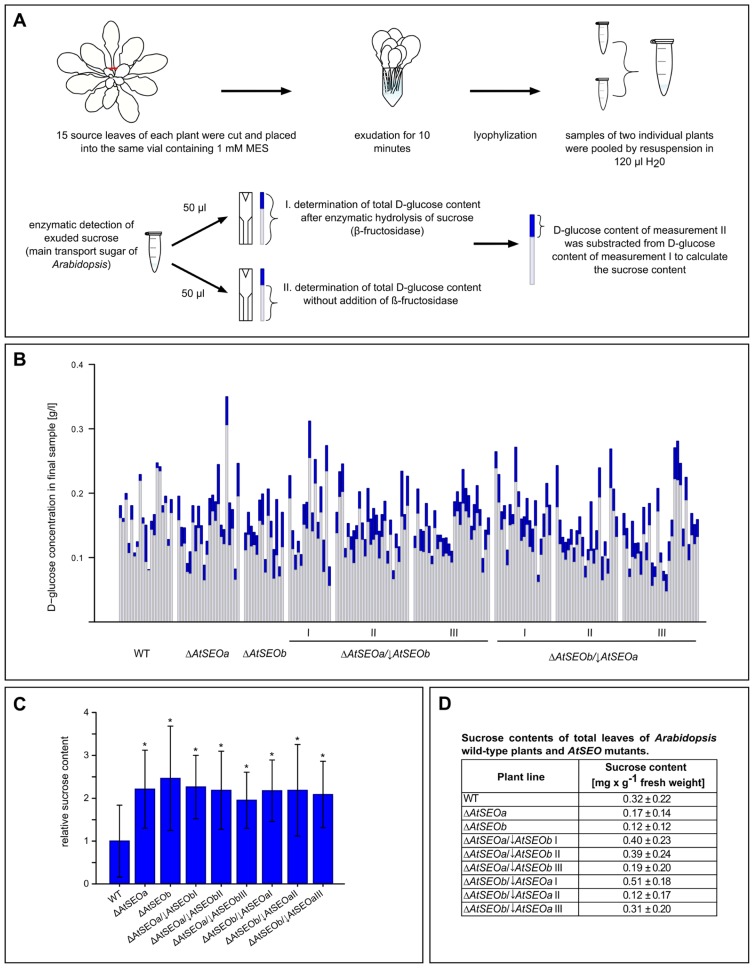
Analysis of exudation rates in wild-type Arabidopsis plants, single AtSEO knockout mutants and AtSEO knockout/knockdown mutants. (A) Schematic overview of the exudation studies. (B) The sucrose content of exudates from wild-type plants (WT) and mutants impaired in the expression of either one (ΔAtSEOa and ΔAtSEOb) or both AtSEO genes (ΔAtSEOa/↓AtSEOb and ΔAtSEOb/↓AtSEOa,lines I–III, respectively) was calculated from the difference in D-glucose concentration before (light blue parts of bars) and after (total bars) the enzymatic conversion of sucrose. (C) Summary of the exudation assays. The mean value of sucrose exuded from wild-type plants was set as 1. The results represent means ± SD; nWT = 19, nΔAtSEOa = 22, nΔAtSEOb = 14, nΔAtSEOa/↓AtSEOblineI = 15, nΔAtSEOa/↓AtSEOblineII = 26, nΔAtSEOa/↓AtSEOblineIII = 27, nΔAtSEOb/↓AtSEOalineI = 20, nΔAtSEOb/↓AtSEOalineII = 22, nΔAtSEOb/↓AtSEOalineIII = 27; *P ≤ 0.001, Mann–Whitney u test. (D) Total leaf controls: total sugars were extracted from ground tissue and sucrose concentrations were determined as described above. The results represent means ± SD; nWT = 8; nΔAtSEOa = nΔAtSEOb = nΔAtSEOa/↓AtSEObI-III = nΔAtSEOb/↓AtSEOaI-III = 4.

