Figure 4.
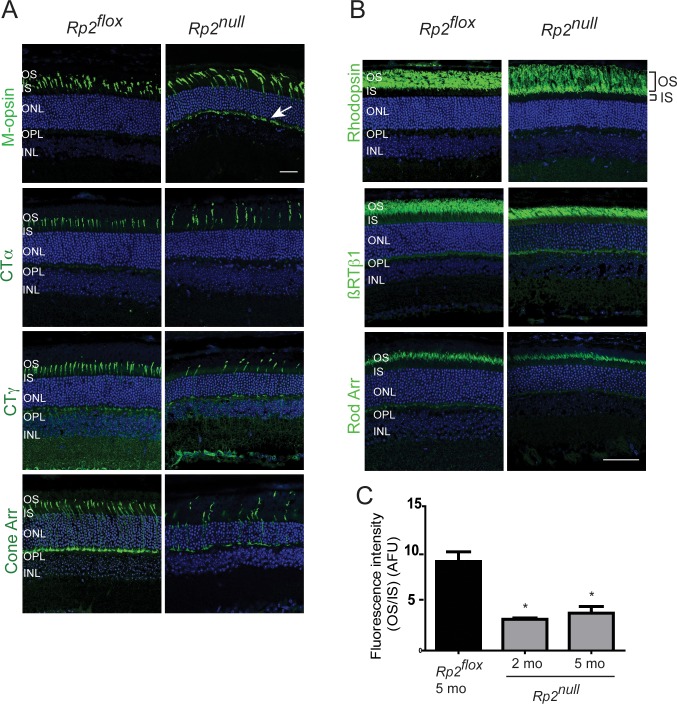
Immunofluorescence analysis of Rp2null retinas. Retinal cryosections from 2 (M-opsin) or 5 months (other antibodies) old Rp2flox (control) or Rp2null mice were stained with cone (A) or rod (B) specific proteins, as indicated (green). CTα, cone transducin alpha subunit; CTγ, cone transducin gamma subunit; Cone Arr, cone arrestin; RTβ1, rod transducin beta1 subunit; Rod Arr, rod arrestin. Arrow (in [A]) shows the mislocalization of cone opsin to OPL. (C) Quantitative analysis of rhodopsin signal was performed by analyzing the ratio of fluorescence intensity of rhodopsin 1D4 staining in outer segment to that in the inner segment (OS/IS; the regions are shown in top panel in [B]) of Rp2flox (control) or Rp2null mice. Fluorescence intensity of rhodopsin was at a distance of 1.0 mm from the ONH. The OS/IS ratios from four sections of three mice in each group were analyzed by two-way ANOVA. Means ± SEM (error bars) are shown. *P < 0.05. Data are represented in arbitrary fluorescence units (AFU).

