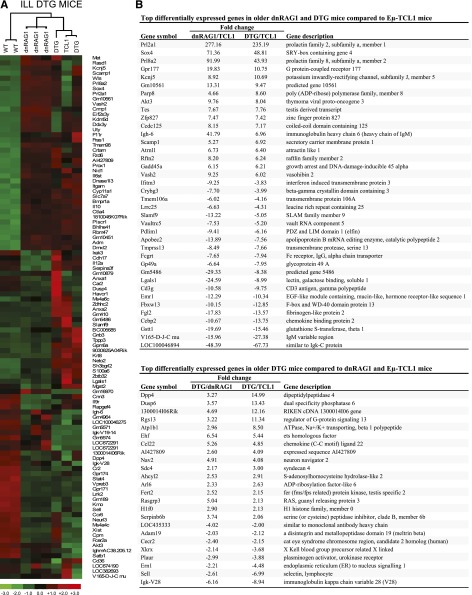
Figure 5.
Identification of genes differentially expressed in WT CD19+B220hiCD5− B cells and CD19+CD5+ B cells from ill DTG mice and age-matched dnRAG1 and Eμ-TCL1 mice. (A) Unsupervised hierarchical clustering of a set of 102 genes that meet the filtering criterion which set the SD for logged data between 1.40 and 1000, and the expression level at >5 in 25% of the samples. (B) Pairwise comparisons were performed using the lower 90% confidence bound interval for genes with ±1.5-fold change filtering criterion. Genes with a mean expression value of <50 in a comparison pair were not included. A list of common genes among the 50 genes that display the greatest differential expression in CD19+CD5+ B cells from dnRAG1 and DTG mice relative to Eμ-TCL1 mice is shown in the top panel. A list of 24 genes that display the greatest differential expression (more than twofold) in CD19+CD5+ B cells DTG mice compared with both dnRAG1 and Eμ-TCL1 mice is shown in the bottom panel.

