
Fig. 9. Inhibiting endogenous γ-aminobutyric acid (GABA)A alters [Ca2+]i in SCN neurons.
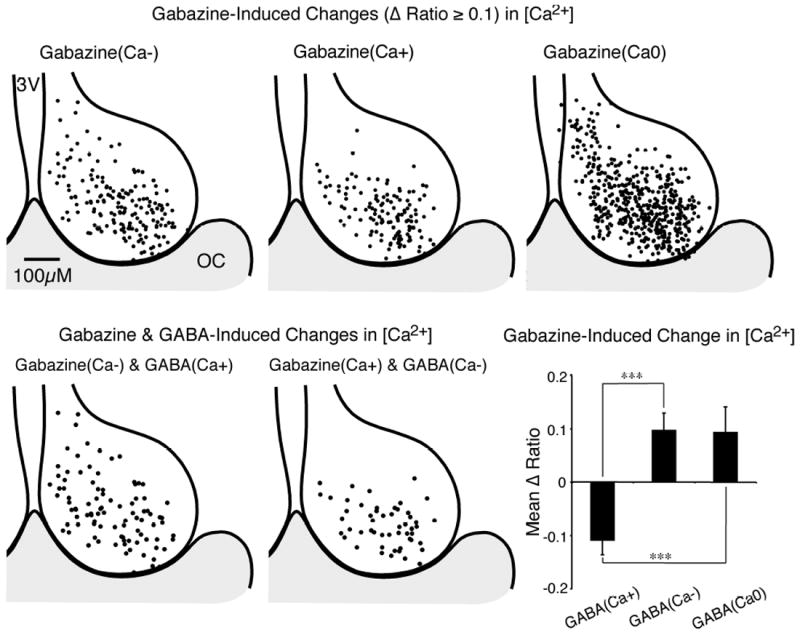
(Top) Regional variation of gabazine-induced (10 μm) changes in baseline Ca2+ ratio in SCN neurons. Responses were separated into three groups: a decrease of the Ca2+ ratio [gabazine(Ca-), top-left]; an increase of the Ca2+ ratio [gabazine(Ca+), top-middle]; and a non-responsive group Ca2+ [gabazine(Ca0), top-right]. The position for each neuron was superimposed on a representative drawing of the SCN, with the 3rd ventricle (3V) on the left and optic chiasm (OC) at the bottom. (Bottom left) Regional localization of individual SCN neurons with a GABA (200 μm)-induced increase in Ca2+ and a gabazine-induced decrease in Ca2+ (see Figs 5 and 8F). (Bottom middle) Regional variation of individual SCN neurons demonstrating both a GABA-induced decease and a gabazine-induced increase of [Ca2+]i. (Bottom right) The mean change in the baseline Ca2+ ratio produced by gabazine was in an opposite direction to the Ca2+ response evoked by GABA. Data are the mean ± SEM of the Ca2+ ratio change in gabazine-responsive neurons for GABA(Ca+) (n = 125), GABA(Ca-) (n = 77) and GABA(Ca0) (n = 65) neurons (F2,264 = 14.74, P < 0.0001, power = 1.00) by anova with Bonferroni t-tests adjusted for three comparisons, ***P < 0.0001. Note that GABA(Ca-) and GABA(Ca0) respond similarly (P = 1).