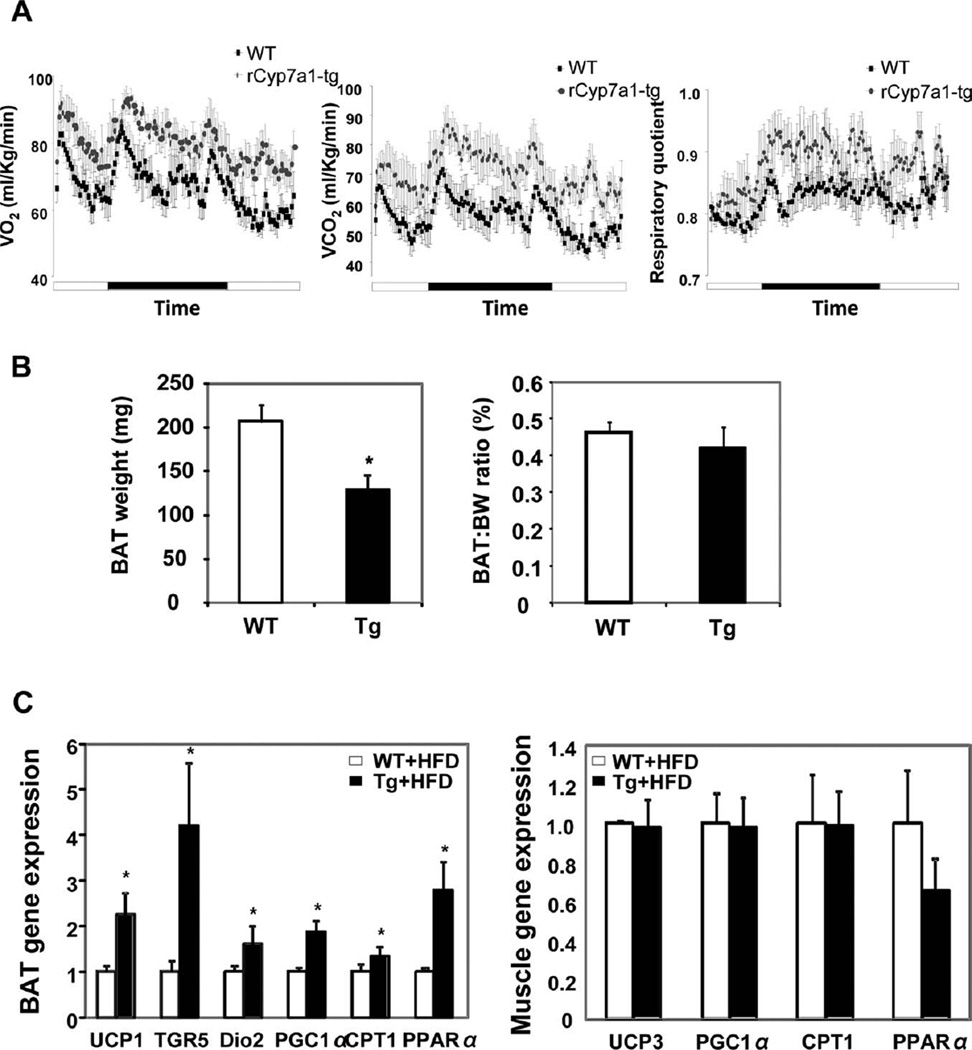
Fig. 7.
Indirect calorimetry analysis of energy expenditure in Cyp7a1-tg mice. Female mice were fed either chow or an HFD for 2 months. (A) O2 consumption and CO2 production were determined in free-fed mice over a period of 24 hours by indirect calorimetry (n =4). For the time, a solid bar indicates the dark cycle, and an open bar indicates the light cycle. The left panel shows VO2, the middle panel shows VCO2, and the right panel shows RQ. (B) The brown adipose mass was determined in female mice fed an HFD (n =6). (C) Female mice on an HFD were refed for 6 hours after 16 hours of fasting, and mRNA expression was measured by real-time PCR (n = 6). Results are expressed as means and standard errors. *Statistically significant difference (P < 0.05) versus WT mice on an HFD. Abbreviations: BW, body weight; CPT1, carnitine palmitoyltransferase 1; Dio2, type 2 deiodinase; PGC1α, peroxisome proliferator-activated receptor γ coactivator-1α; PPARα, peroxisome proliferator-activated receptor α; Tg, transgenic; WT, wild-type.

