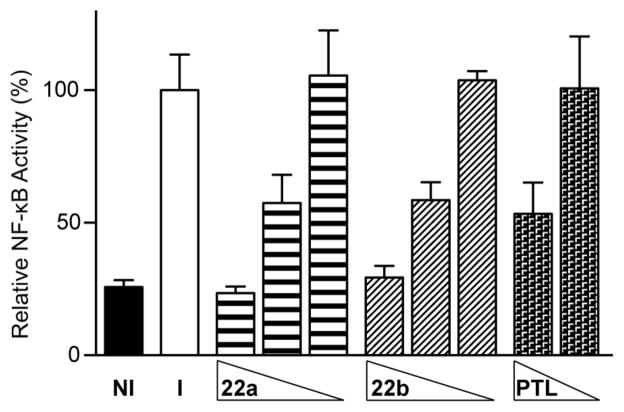
Figure 2.
NF-κB luciferase reporter assay in A549 cells. Compounds 22a-b were dosed at 20, 10, and 1 μM and PTL was dosed at 10 and 1 μM. Cells were induced with TNF-α (15 ng/mL) 30 min after molecule treatment, except NI control. Shown is the mean of triplicate data and error bars represent propagated standard deviation. NI = non-induced, I = induced.

