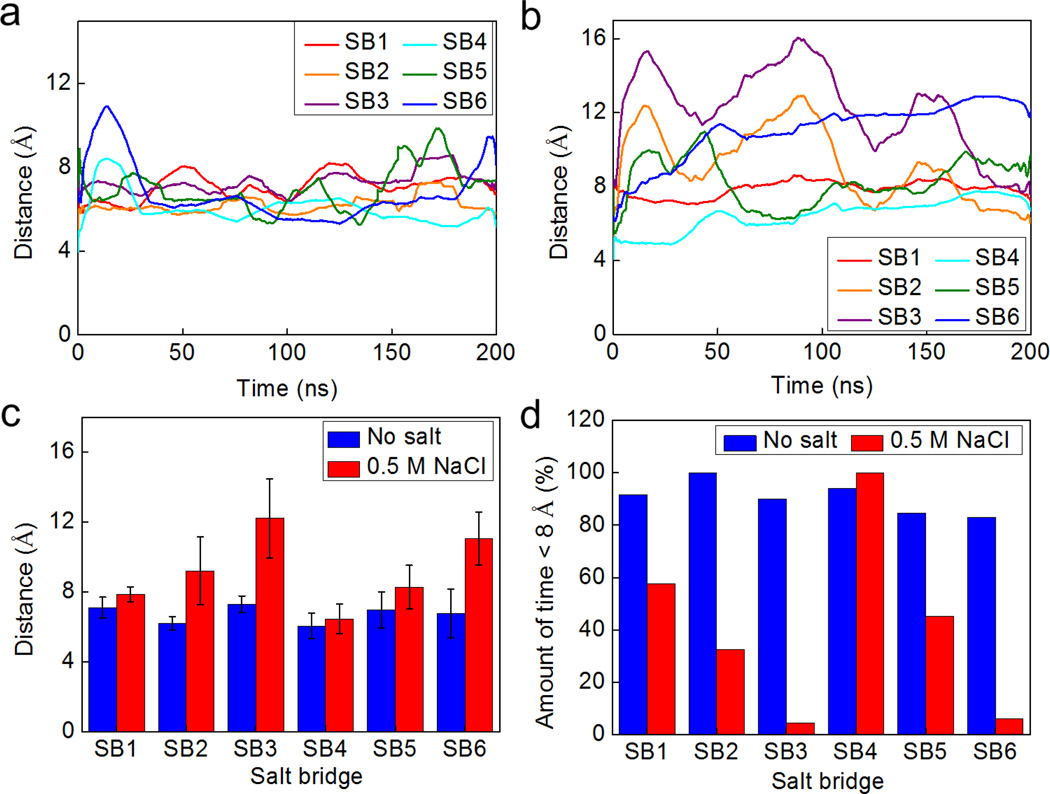
Figure 4. Fluctuation of the salt bridges within the dimer during the equilibrium at time-scales of hundreds of nanoseconds simulated by the coarse-grained model.
Panel a/b: Fluctuations of the distance between the mass center of the two amino acids involved in each of the salt bridge in non-salt condition (panel a) and for the solution with 0.5 M NaCl (panel b). Panel c: Statistical result (average ± standard deviation) for the distance of each of the salt bridge during the 200 ns equilibrium. Panel d: Amount of time the residue pair has been in an effective salt bridge state (< 8 Å for the coarse-grained model).

