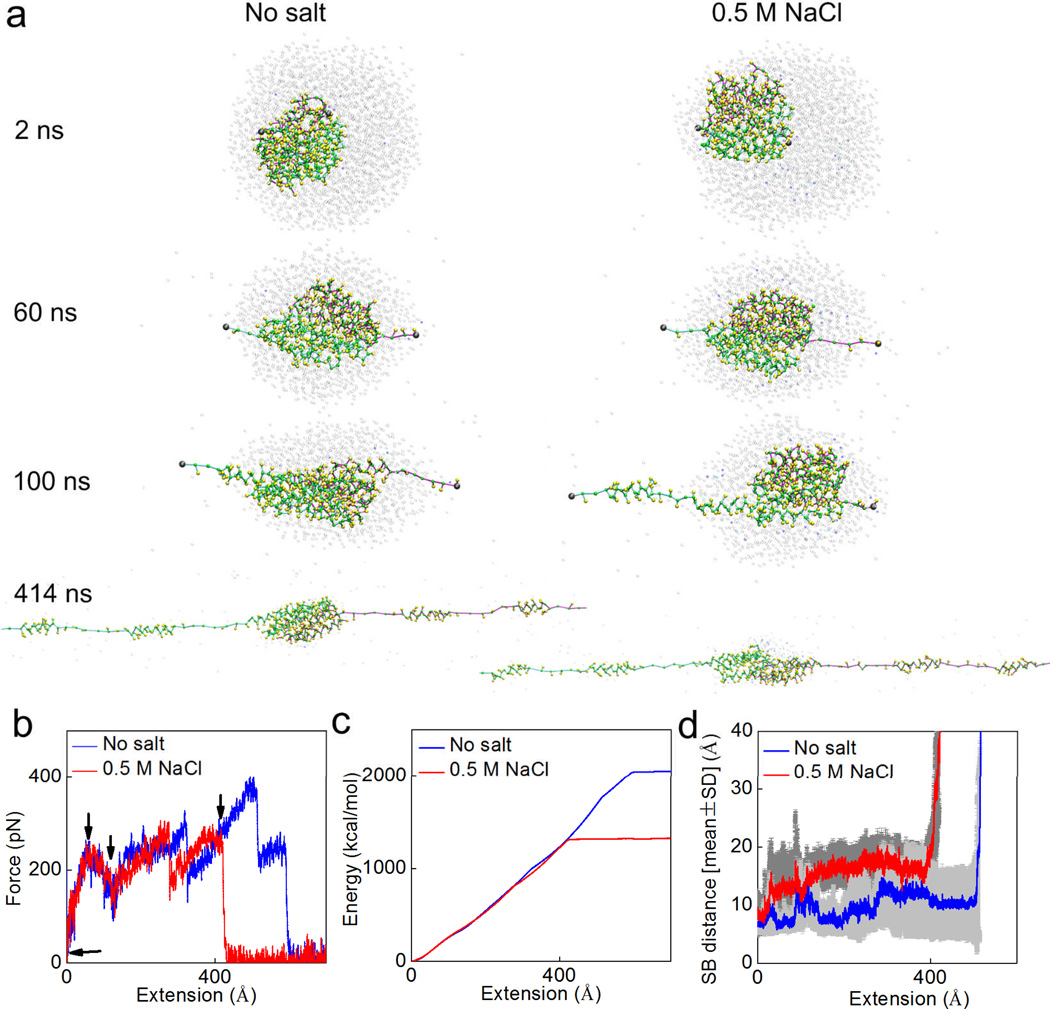
Figure 6. Simulation snapshots for the deformation and mechanical response analysis during pulling apart of the dimer.
Panel a: Simulation snapshots taken as the applied extension is increased up to 400 Å. Panel b: Force-extension curve of the dimer under stretching with a rate of 0.1 m/s. Each of the arrow in this panel points to place where the corresponding snapshot in panel a is taken. Panel c: External energy applied to break the structure as a function of the extension, as the amount of area integrated below the force-extension curve. Panel d: the statistic result (average ± standard deviation for every 20 ps) of the distances of all the salt bridges (SB1–SB6) during the extension process. It is noted that the salt condition makes the dimer easier to break apart by breaking the salt bridges.

