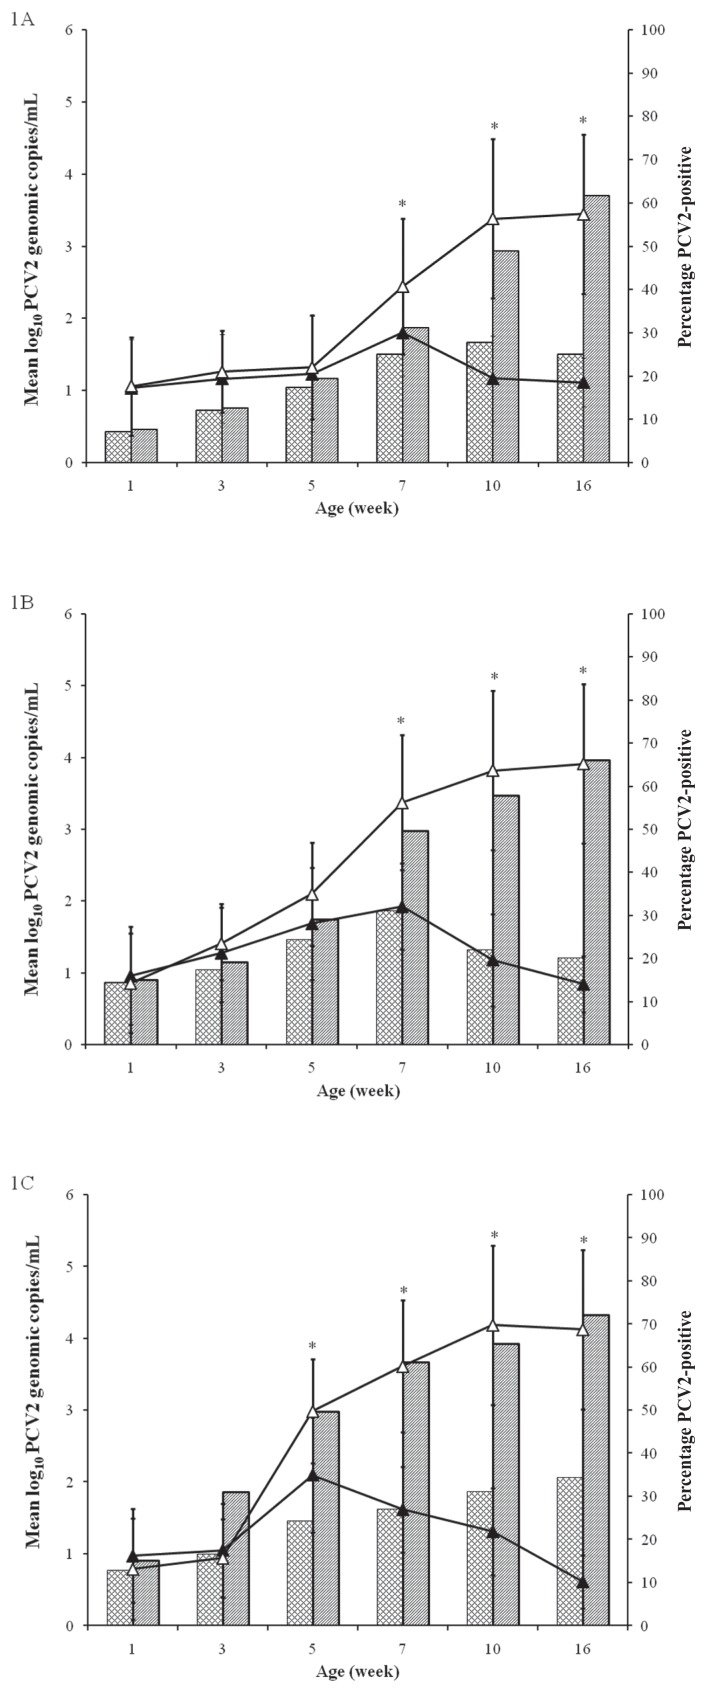
Figure 1.
Mean group log10 load of DNA of Porcine circovirus type 2 (PCV2) in the blood of vaccinated (black triangles) and nonvaccinated (white triangles) piglets and percentage of PCV2-viremic pigs in the vaccinated (cross-hatched bars) and nonvaccinated (bars with diagonal lines) groups for farms A, B, and C. Asterisks indicate a significant (P < 0.05) difference between the 2 groups at the same time point.

