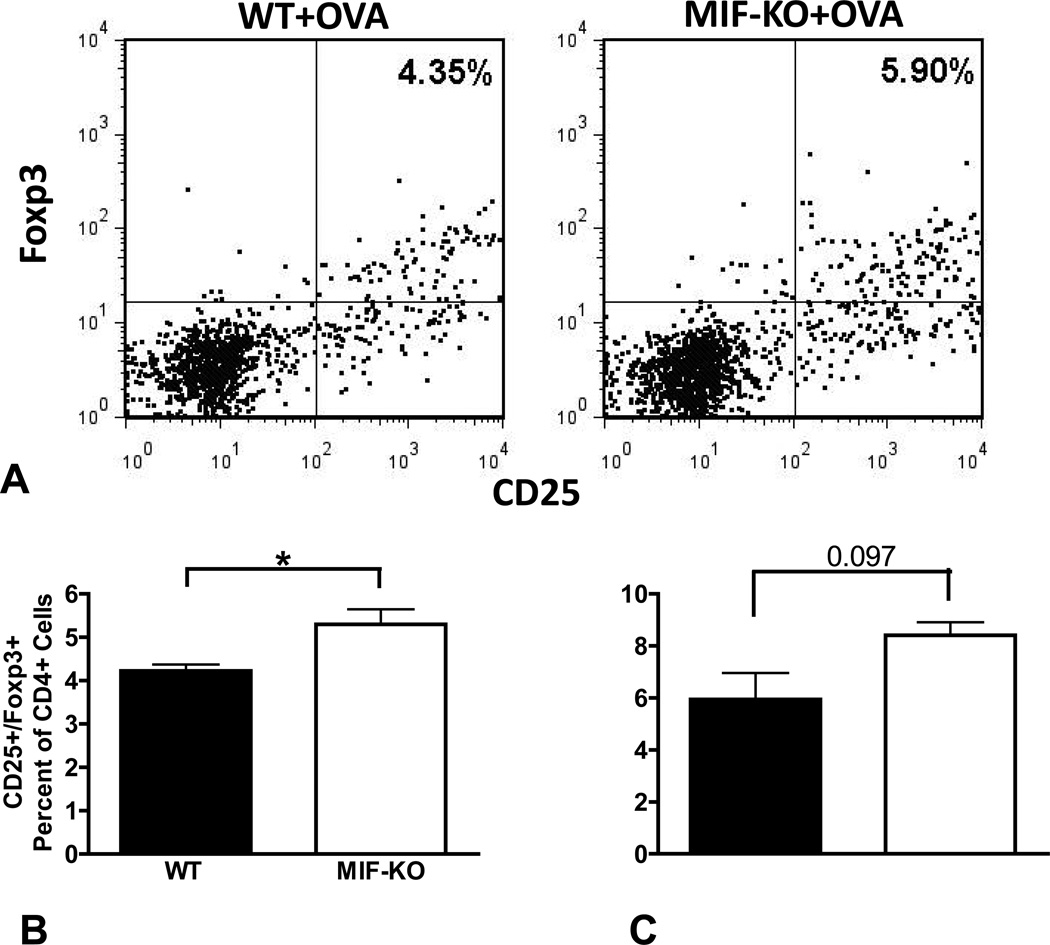
Figure 3.
Tregs are increased in the MIF-KO lymph node cultures. (A&B) The number of CD4 T cells which display Treg markers (CD25+, Foxp3+) are increased in the MIF-KO compared to WT systems. (C) Foxp3 upregulation, measured by qRT-PCR is also increased in the MIF-KO compared to WT, although this increase does not reach statistical significance. WT (n=4), MIF-KO (n=3). Summary data are pooled from three independent expeirments *** p<0.001, **p<0.01, *p<0.05.

