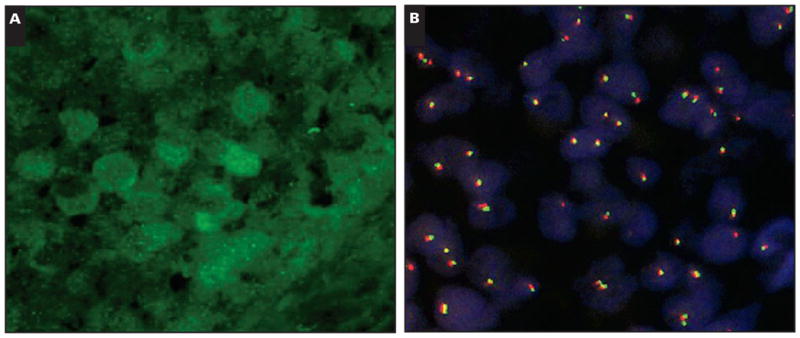
Image 3.

Immunofluorescence in situ hybridization analysis showing the green cyclin D1+ cells in the immunohistochemical stain (A) and the results of the CCND1 break-apart probe in this specific region (B). Cells with split signals indicating a CCND1 translocation are not seen. Note 2 fusion signals in all informative cells in the region of the cyclin D1 positive proliferation center. The cells with a single fusion signal or rare cells with a single red or green signal represent truncation. (A, fluorescence cyclin D1 stain, ×1,000; B, cyclin D1 break-apart probe, ×1,000.)
