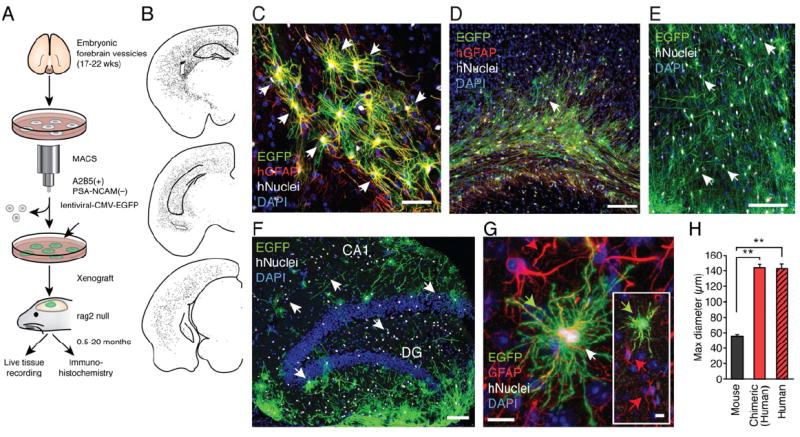
Figure 1. Human astrocytes replace host glia in mice engrafted with human glial progenitors.

(A) Schematic outlining the procedure for magnetic cell sort-based isolation (MACS) of human glial progenitors, tagging with EGFP, and xenografting at P1. The chimeric mice brains were analyzed in 0.5-20 months old chimeric mice. (B) Representative dot map showing the distribution of human nuclear antigen (hNuclei)+ cells in 3 coronal sections from a 10 months-old human chimeric mice. (C) The complex fine structure of human astrocytes in chimeric brain replicates the classical star-shaped appearance of human astrocytes labeled with hGFAP in situ. Most cells in the field are EGFP+/hNuclei+/hGFAP+ (hGFAP, red). (D) At 5 months, EGFP+ cells typically infiltrated corpus callosum and cortical layers V and VI. All EGFP+ cells labeled with an antibody directed against human nuclear antigen (hNuclei) and most of the human cells were also labeled with an antibody directed against human GFAP (hGFAP, red). (E) At 11 months, many areas of cortex were infiltrated by evenly distributed EGFP+ /hNuclei+ cells. (F) The hippocampus was also populated with EGFP+/hNuclei+ cells in a 14 months old animal, with the highest density in the dentate. (G) Human EGFP+/hNuclei+/GFAP+ cells (green arrow) were significantly larger than host murine astrocytes (red arrow). The anti-GFAP antibody cross-reacted with both human and mouse GFAP (red). Inset shows same field in lower magnification. (H) Histogram compares the diameter of mouse cortical astrocytes to human cortical astrocytes in situ (freshly resected surgical samples) and xenografted human astrocytes in cortex of chimeric mouse brain. The maximal diameter of mouse and human astrocytes (in situ and in chimeric mice) was determined in sections stained with an anti-GFAP antibody that labels both human and mouse GFAP. (n=50-65; **, p<0.01, Bonferroni t-test. (B-F): EGFP (green); hNuclei (white and white arrow); DAPI (blue).
Scale: 50 μm (C); 100 μm (D-F); and 10 μm (G). Data graphed as means ± SEM.
See also: Supplementary Figure S1.
