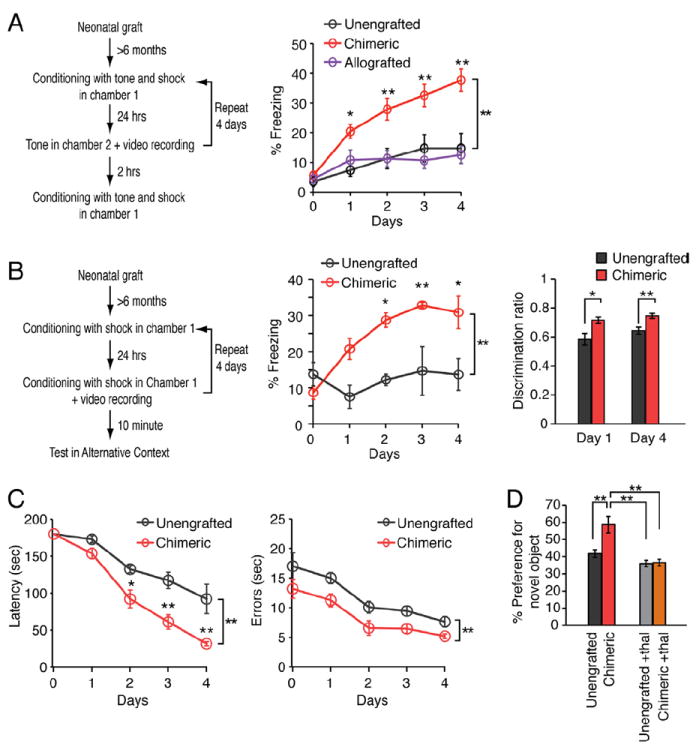
Figure 6. Humanized chimeric mice learn faster than controls.

(A) Auditory fear conditioning assessed in a cohort of human chimeric, mouse chimeric, and unengrafted control rag1 mice. Chimeric mice exhibit prolonged freezing behavior in test chamber 2, during exposure to the tonal conditioned stimulus when compared to unengrafted mice and allografted mice (n = 5-20; *, p<0.05; **, p<0.01; two-way repeated measures ANOVA with Bonferroni test; means ± SEM). This difference persisted throughout all 4 days. (B) Contextual fear conditioning in human glial-chimeric mice and littermate controls. Freezing behavior was quantified for chimeric and unengrafted littermate controls during the two minutes of acclimatization period (n = 6; *, p<0.05; **, p<0.01; two-way repeated measures ANOVA with Bonferroni test). In addition the mean discrimination ratio for each day was obtained from freezing scores in the training chamber and the alternative chamber (freezing in training chamber/ total freezing time). Chimeric mice demonstrated significantly higher abilities to discriminate the chambers (n = 8-13; *, p<0.05; **, p<0.01; two-way repeated measures ANOVA with Bonferroni test). (C) Barnes maze testing in chimeric and unengrafted littermate controls. Chimeric mice demonstrated a significant learning advantage, as reflected in a shorter latency and fewer errors in solving the maze (n = 6; *, p<0.05; **, p<0.01; two-way repeated measures ANOVA with Bonferroni test). (D) Object-Location Memory Task (OLT) in chimeric mice and their unengrafted littermate controls demonstrated a learning advantage in chimeric mice via enhanced recognition of the novel displaced object. Thalidomide eliminated the learning advantage of chimeric mice suggesting the learning enhancement was TNF-α mediated (n = 7; **, p < 0.01; one-way ANOVA with Bonferroni test).
All data plotted as means ± SEM.
See also: Supplementary Figure S5.
