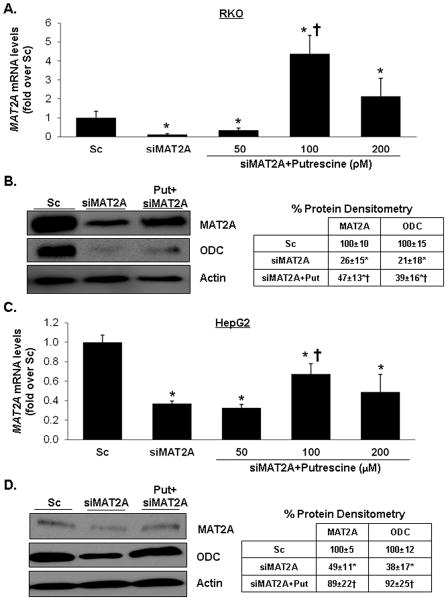
Fig. 3. Effects of MAT2A knockdown and putrescine on MAT2A and ODC expression.
RKO (A and B) and HepG2 (C and D) cells were treated with Sc or siMAT2A (12 pM for 48 hours) ± putrescine in varying doses for the last 24 hours. MAT2A and ODC expression was determined by real-time PCR (A and C) and Western blotting (B and D). MAT2A mRNA results represent mean±SEM from 3 to 4 independent experiments performed in duplicate. *p<0.04 vs. Sc, †p<0.03 vs. siMAT2A. Densitometric changes in protein levels are summarized in the boxes adjacent to blots. Results are expressed as % of Sc from 3 to 4 independent experiments, *p<0.01 vs. Sc, †p<0.05 vs. siMAT2A.

