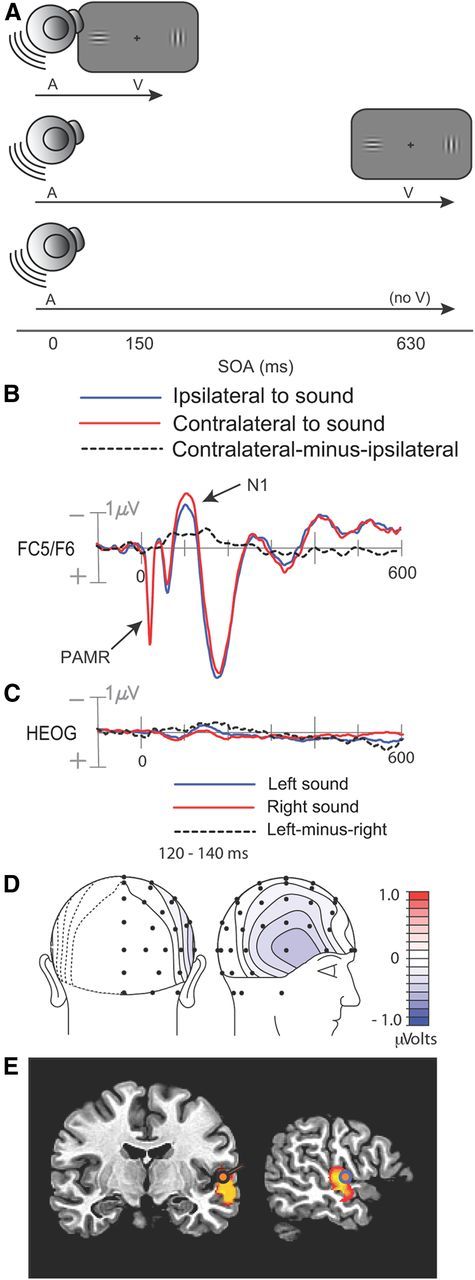
Figure 1.

Experimental procedure and results from Experiment 1. A, Illustration of auditory cue and visual target stimuli on short-SOA trials, long-SOA trials, and no-target catch trials. B, Cue-elicited ERPs recorded over the frontocentral scalp, collapsed over scalp sites ipsilateral and contralateral to the side of stimulation. C, Averaged EOG waveforms associated with left and right noise-burst cues. D, Voltage topography of the late, lateralized phase of the cue-elicited N1, quantified as the contralateral minus ipsilateral difference amplitude in the 120–140 ms interval. E, Best-fitting dipole and distributed source activity underlying the lateralized N1 in the 120–140 ms interval.
