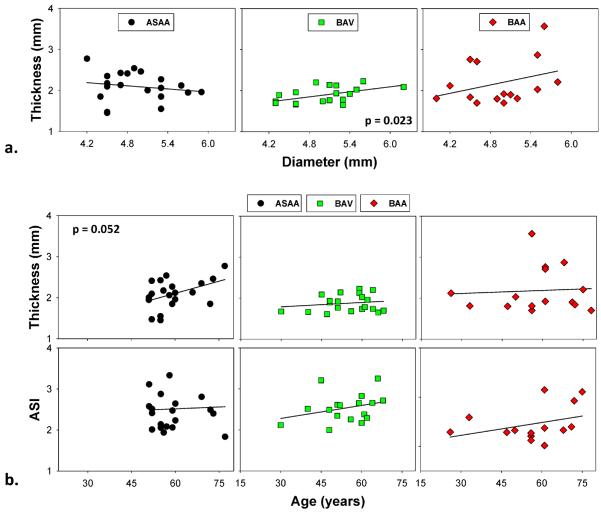
Figure 2.
(a) Diameter and thickness relationship of ASAA, BAV and BAA patient groups, the BAV group showed a strong correlation (p = 0.02); (b) a consistent trend of increasing thickness and ASI with increasing age in all groups, the ASAA group showed a near significant correlation between thickness and age (p = 0.052).

