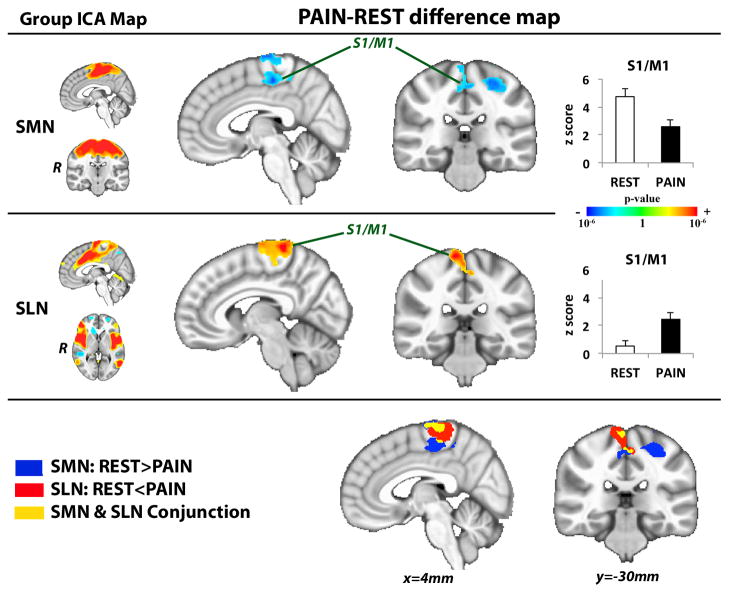
Figure 2. S1/M1 connectivity shifts from SMN to SLN during sustained pain.
Difference maps contrasting functional connectivity during PAIN versus REST noted increased SLN and reduced SMN connectivity to contralateral S1/M1. ICA=independent component analysis, SLN=salience network, SMN=sensorimotor network. Plot error bars denote standard error of the mean.

