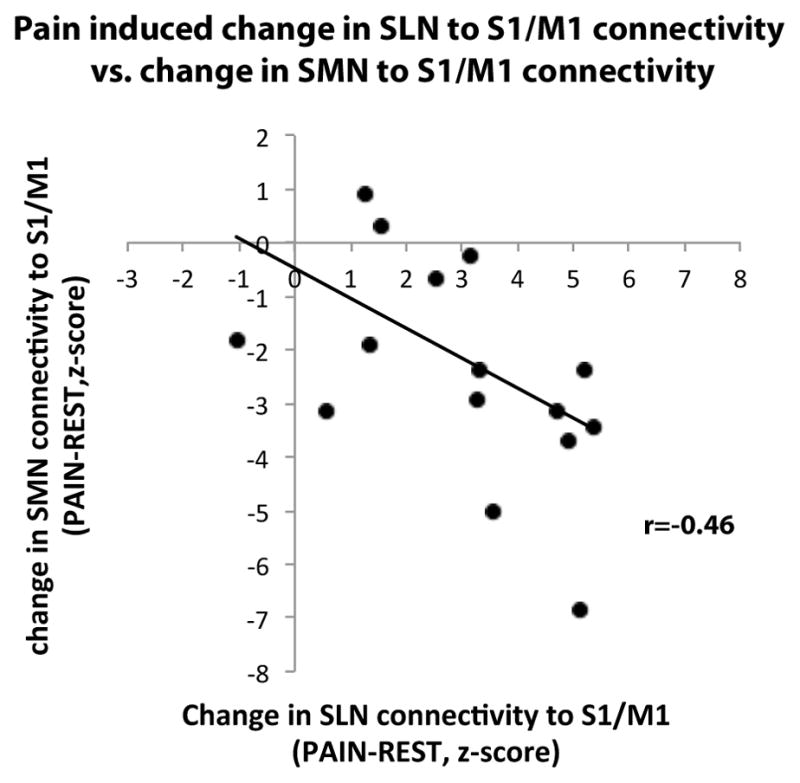
Figure 3. Inter-subject correlation between increased SLN connectivity to S1/M1 and decreased SMN connectivity to S1/M1.

Subjects who responded to sustained pain with greater increased SLN connectivity to S1/M1 (positive z-scores in x axis represent greater SLN connectivity to S1/M1 during PAIN compared to REST), also demonstrated more decrease in SMN connectivity to S1/M1 (negative z-scores in y axis represent reduced SMN connectivity to S1/M1 during PAIN compared to REST).
