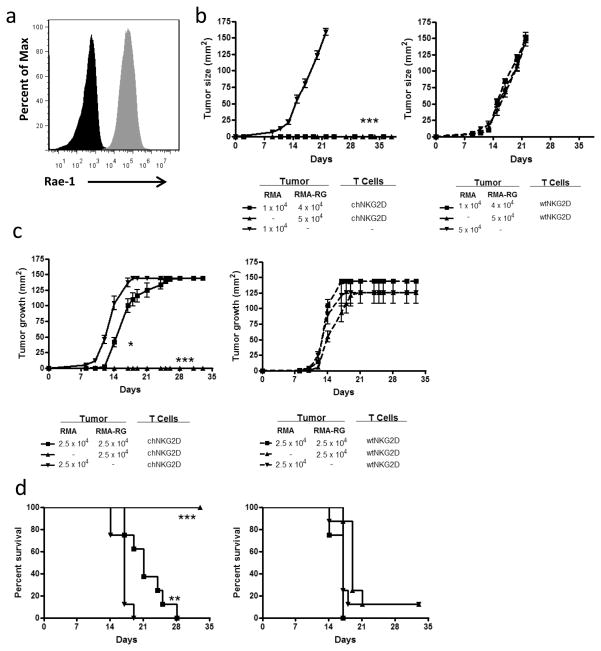
Figure 1. CAR T cell therapy treats heterogeneous lymphomas.
(a) Rae-1 expression on RMA (black) and RMA-RG (gray) tumor cells was assessed by flow cytometry. (b) RMA tumor cells (1 × 10⁴ or 5 × 10⁴), RMA-RG cells (5 × 10⁴) or a 4:1 mixture of both tumor cells (RMA-RG:RMA) were injected s.c. into mice (n = 8). At the same time as tumor inoculation, wtNKG2D or chNKG2D T cells were injected together with the tumor cells s.c.. Tumor area was measured and data are presented in mm2. (***, p < 0.001 vs. wtNKG2D). RMA tumor cells (2.5 × 10⁴), RMA-RG cells (2.5 × 10⁴) or a 1:1 mixture of both tumor cells (2.5 × 10⁴ RMA-RG: 2.5 × 10⁴ RMA) were injected s.c. into mice (n = 8). At the same time, wtNKG2D T cells or chNKG2D T cells were injected together with the tumor cells s.c.. (c) Tumor area and (d) survival were measured (n = 8). Data are presented in mm2. (*, p < 0.05; **, p < 0.01; ***, p < 0.001 vs. RMA + chNKG2D). Differences between groups in a and b were analyzed by ANOVA and Newman-Keuls post test, and by log-rank test in c. SD is shown.

