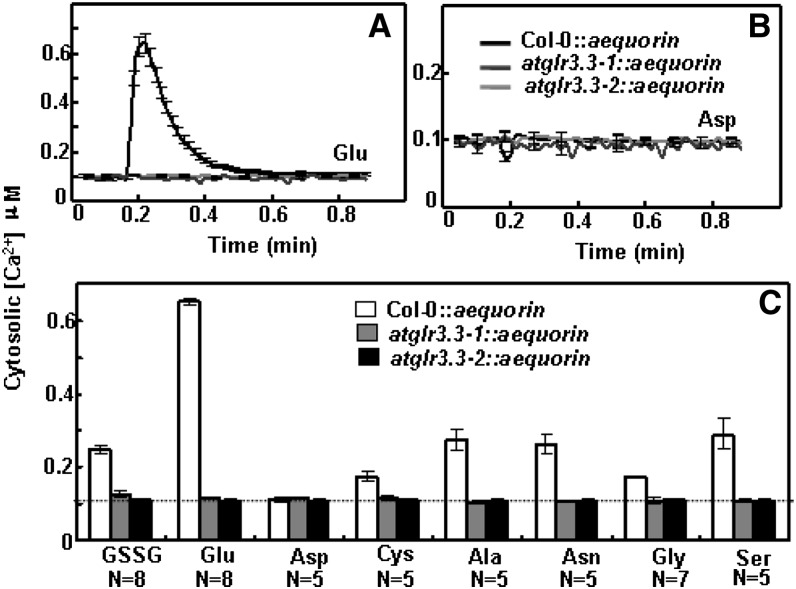
Figure 8.
Effects of the seven putative ligands of AtGLR3.3 and Asp on the [Ca2+]cyt in the leaf cells of ecotype Columbia (Col-0) and atglr3.3 expressing aequorin. Averaged recording curves with se of 100 µm Glu (A) and Asp (B) induced [Ca2+]cyt rise in the leaf cells of Col-0 and atglr3.3-1 and atglr3.3-2 mutants expressing aequorin (n = 8 for Glu and n = 5 for Asp). C, the average peak values with se of the response to the indicated ligands (n = 8 for GSSG and Glu, n = 5 for Asp, Cys, Ala, Asn, and Ser, and n = 7 for Gly). The asterisk indicated sd at P < 0.01 between the mutants and Col-0 for the same treatment. The dash line indicated the background [Ca2+]cyt.

