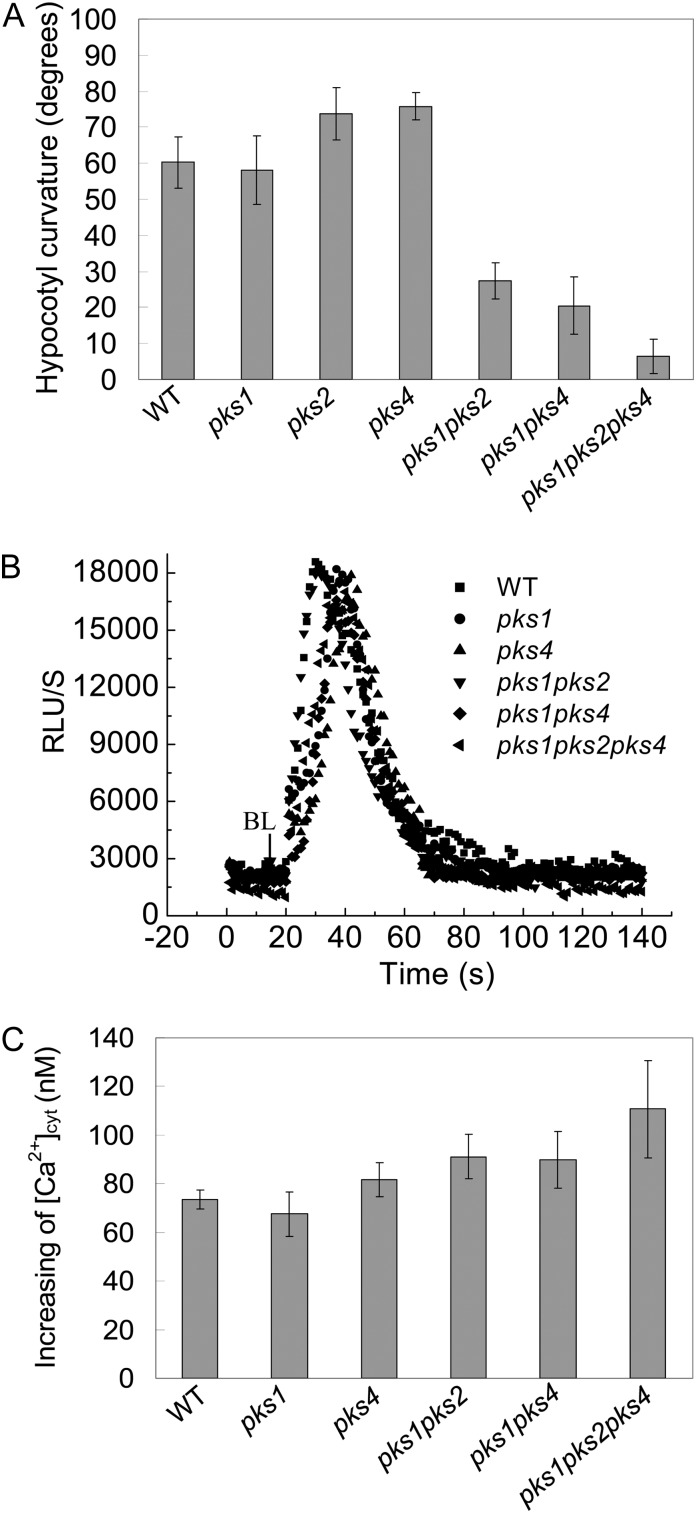
Figure 11.
Analysis of hypocotyl phototropic curvature and changes in cytosolic Ca2+ induced by BL in pks single and multiple mutants. A, Seedlings of the indicated genotypes were grown in darkness for 72 h and treated with 100 μmol m−2 s−1 BL for 12 h. The hypocotyl phototropic curvature was measured as a change in hypocotyl angle as determined from an analysis of stacked images. Data are average curvature angles ± sd with a minimum of 45 seedlings per genotype. B, The changes in relative luminescence (RLU) indicate the changes in [Ca2+]cyt in response to 100 μmol m−2 s−1 BL for 15 s in etiolated seedlings of the indicated genotypes. C, The mean changes in [Ca2+]cyt shown in B. The values are averages of three independent experiments (11–21 measurements each) with sd. WT, Wild type.

