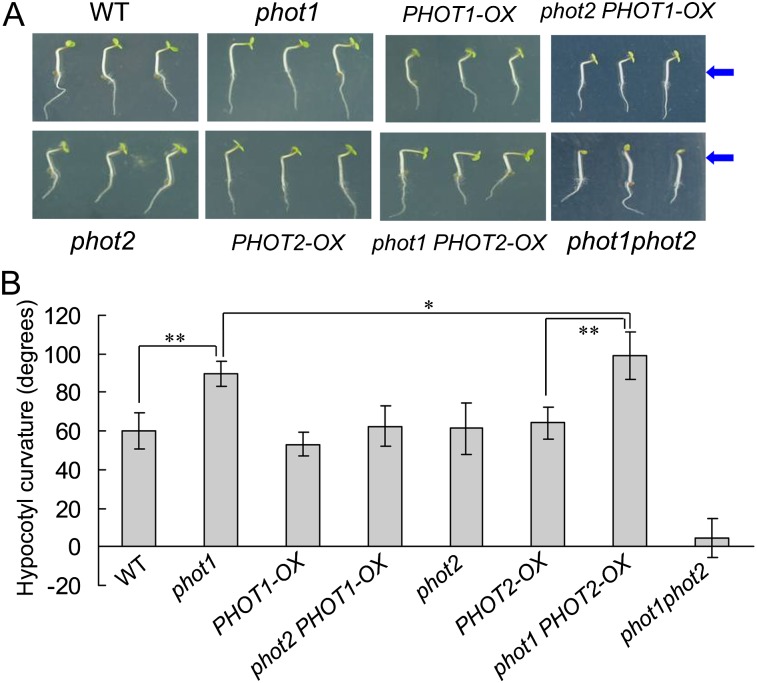
Figure 7.
Analysis of hypocotyl phototropic curvature in phot1- or phot2-deficient mutants and overexpression plants. A, Photographs were taken of 3-d-old wild-type (WT), phot1, phot2, phot1phot2, PHOT1-OX, PHOT2-OX, phot1 PHOT2-OX, and phot2 PHOT1-OX etiolated seedlings grown on the same vertical plates and exposed to BL illumination at 100 μmol m−2 s−1 for 12 h. Arrows indicate the direction of BL illumination. B, Phototropic curvature was measured as the change in hypocotyl angle as determined from an analysis of stacked images. The values are averages of three independent experiments (30–45 measurements each) with sd. *P < 0.05, **P < 0.01.

