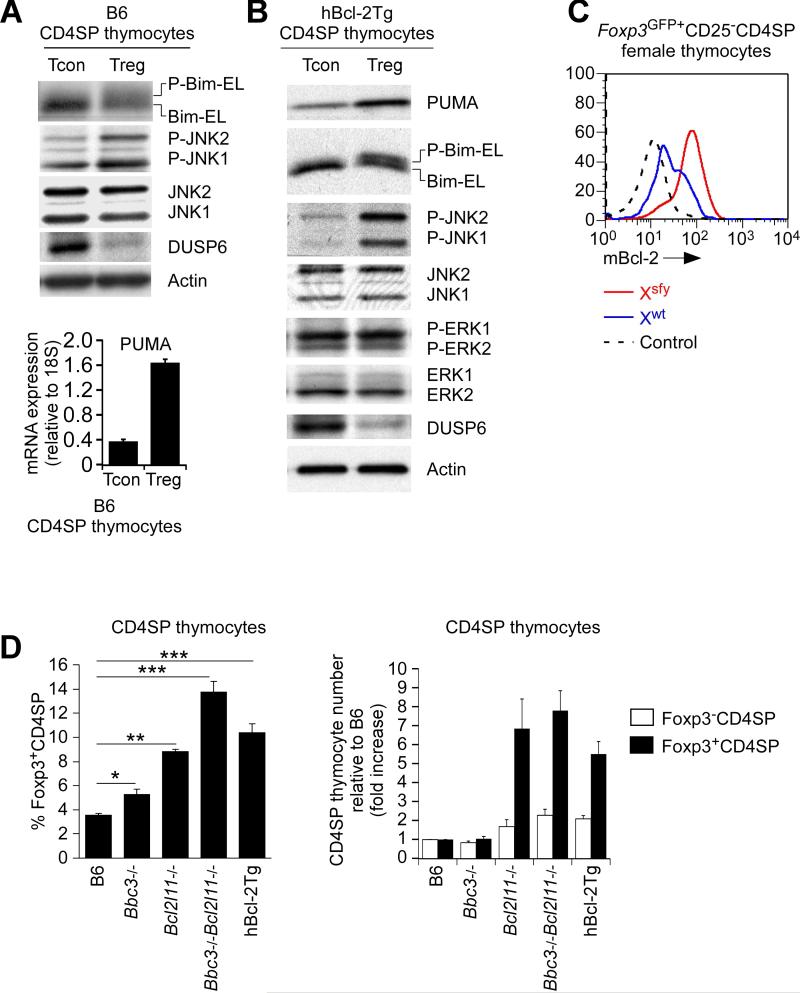
Figure 3. Normal Tregs display the Foxp3 pro-apoptotic protein signature.
(A and B) Protein immunoblots of conventional (Foxp3−CD25−) and regulatory (Foxp3+CD25+) CD4SP thymocytes from B6 (A) and hBcl-2Tg mice (B) containing the Foxp3-GFP reporter (Bettelli et al., 2006). Puma mRNA (A lower panel) was determined by quantitative RT-PCR relative to 18S rRNA (mean ± SE of triplicate samples). Data in A are representative of 2 experiments and data in B of 4 experiments.
(C) Intracellular mBcl-2 expression in Treg subpopulations (Xwt and Xsfy) in the thymus of heterozygous B6xScurfy female mice expressing the Foxp3GFP reporter. Dashed lines represent negative control staining. Data are representative of 2 experiments.
(D) Frequency (left) and relative number of Foxp3+CD4SP thymocytes compared to B6 (right). Mean ± SE of 5-10 mice per group.
*, p<0.01; **, p<0.001; ***, p<0.0001.
See also Figure S3.

