
Figure 4.
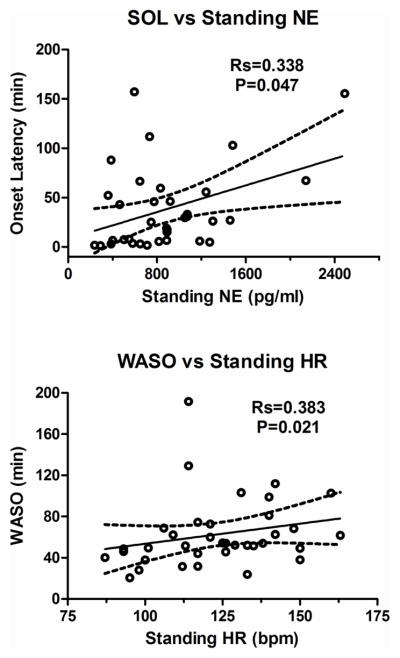
Spearman correlations (Rs) are presented for actigraphic sleep onset latency (SOL) versus standing norepinephrine (NE) levels (top panel) and actigraphic wake after sleep onset (WASO) and standing heart rate (HR; bottom panel).
Official websites use .gov
A
.gov website belongs to an official
government organization in the United States.
Secure .gov websites use HTTPS
A lock (
) or https:// means you've safely
connected to the .gov website. Share sensitive
information only on official, secure websites.
Spearman correlations (Rs) are presented for actigraphic sleep onset latency (SOL) versus standing norepinephrine (NE) levels (top panel) and actigraphic wake after sleep onset (WASO) and standing heart rate (HR; bottom panel).