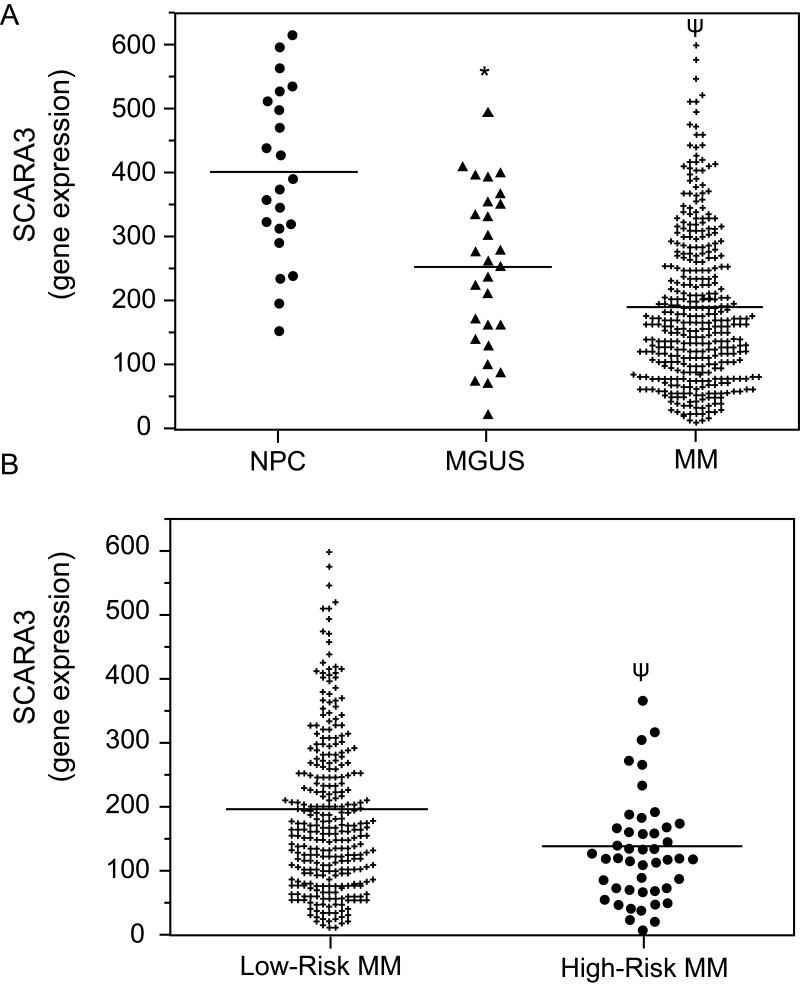
Fig. 4.
In primary human myeloma samples, lower levels of SCARA3 expression correlate with disease progression and high-risk MM. GEP analysis of the relative expression levels of SCARA3 mRNA in (A) NPC (n=22), MGUS (n=44), or myeloma patients (n=351), or (B) myeloma patients with high-risk (n=46) versus low-risk (n=305) disease. !P<0.001 versus NPC or ! P<0.01 versus MGUS or low-risk MM.

