
Figure 2.
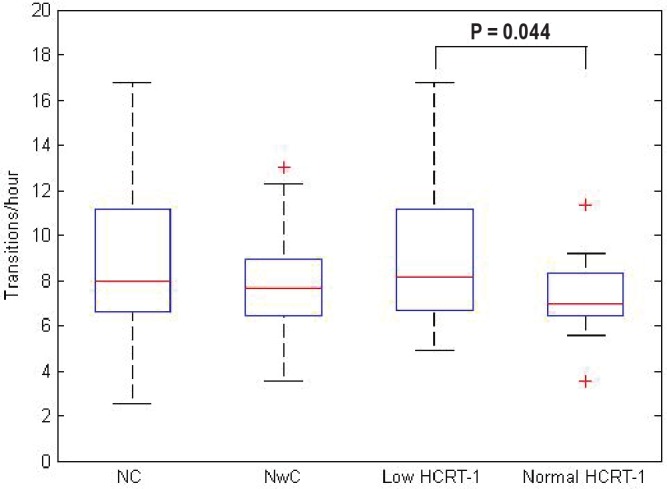
Frequency of rapid eye movement-nonrapid eye movement transitions illustrated in box plots for each patient group. Each box plot shows the fi fth, 25th, 50th, 75th, and 95th percentile. Signifi cant P values are shown. Hcrt, hypocretin-1; NC, narcolepsy with cataplexy; NwC, narcolepsy without cataplexy.