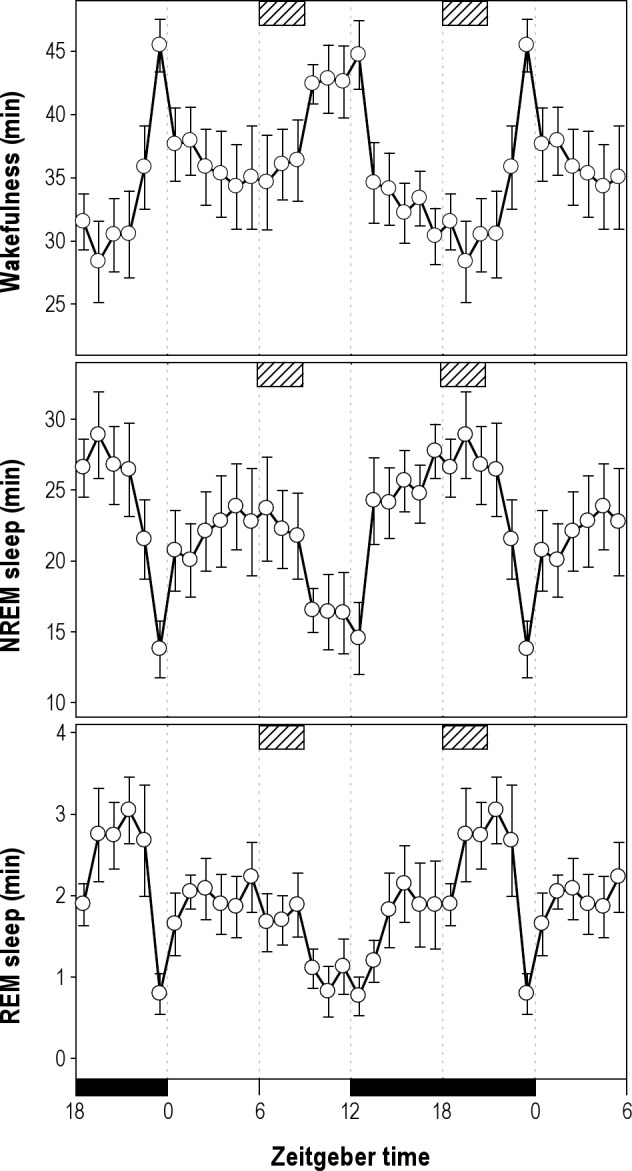
Figure 1.

Mean curve of sleep-wake states. Circles correspond to the hourly mean time of each state (± standard error of the mean) obtained during 4 undisturbed days in nine male O. degus. For clarity, the initial and final 6 h are double-plotted. Horizontal black bars indicate dark phase. Hatcheds bar in upper abscissa indicate diurnal (RH06) and nocturnal (RH18) deprivation time. NREM, nonrapid eye movement; REM, rapid eye movement.
