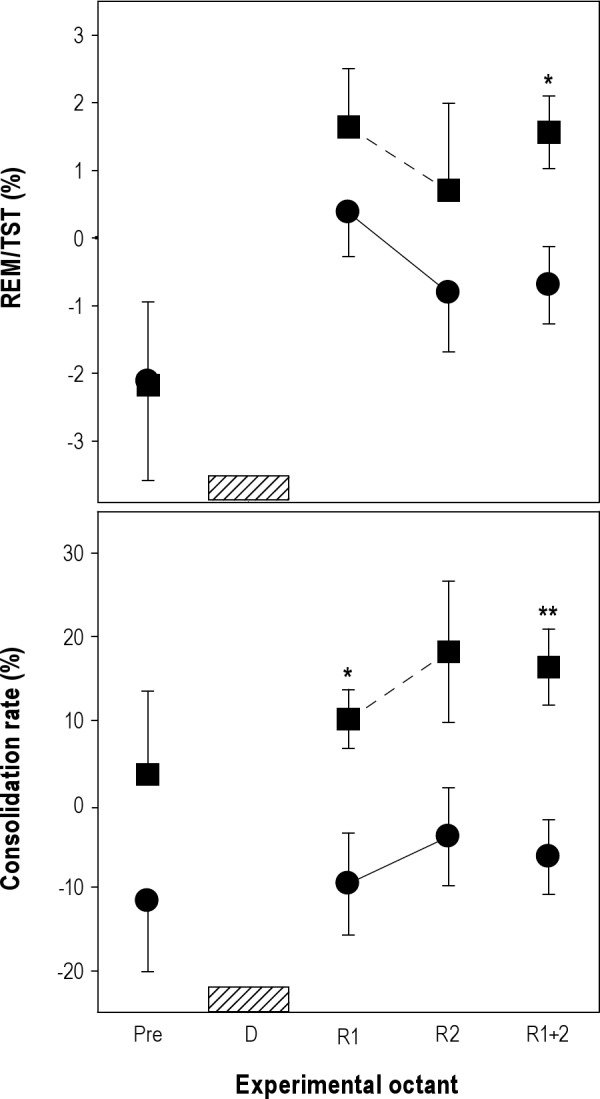
Figure 5.

Comparisons of the REM sleep homeostatic response after diurnal and nocturnal deprivations. Values correspond to the mean (± standard error of the mean) obtained in nine O. degus and are expressed as differences with respect to baseline. Diurnal (closed circles) and nocturnal (closed squares) data were aligned to deprivation interval (hatched bar): preceding octant (Pre), deprivation octant (D, hatched bar), and recovery octants (R1, R2, and collapsed recovery octants R1 + 2). *P < 0.05, **P < 0.01 two-tailed paired t-test of nocturnal versus diurnal differences. REM, rapid eye movement; TST, total sleep time.
