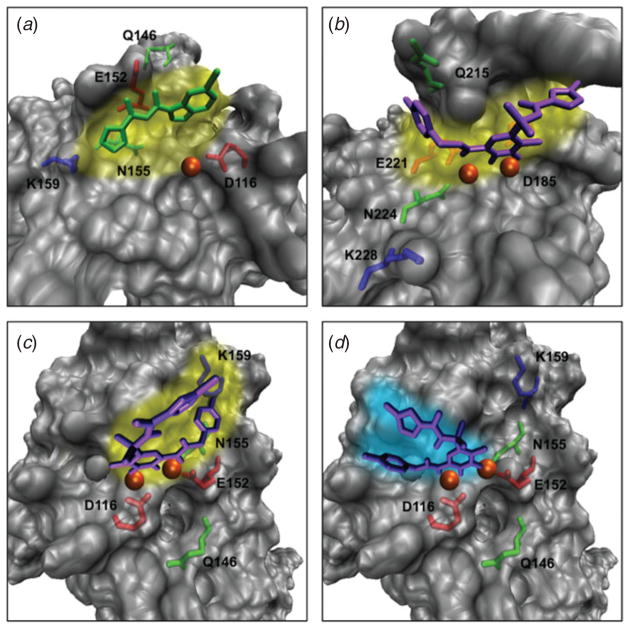
Fig. 5.
Drug/inhibitor-binding pockets to HIV integrase as solved experimentally and as predicted by modeling. (a) Preferred (or primary) binding (yellow shading) of the inhibitor 5-CITEP (green) to the active site of the HIV-1 integrase core domain as determined by crystallography (Goldgur et al. 1999); (b) preferred binding (yellow shading) of the anti-HIV drug Raltegravir (purple) to the active site of the prototype foamy virus (PFV) integrase, a structural homologue of HIV-1 integrase, as determined by crystallography (Hare et al. 2010); (c) predicted preferred binding (yellow shading) for Raltegravir to the HIV-1 integrase catalytic core domain as determined by modeling (Perryman et al. 2010); (d) alternative, or flipped binding (turquoise shading) for Raltegravir to the HIV-1 integrase catalytic core domain as determined by modeling (Perryman et al. 2010). C and D are based on PDB entry 1QS4, with missing residues in panel (A) reconstructed by homology. The magnesium ions are shown as orange spheres.

