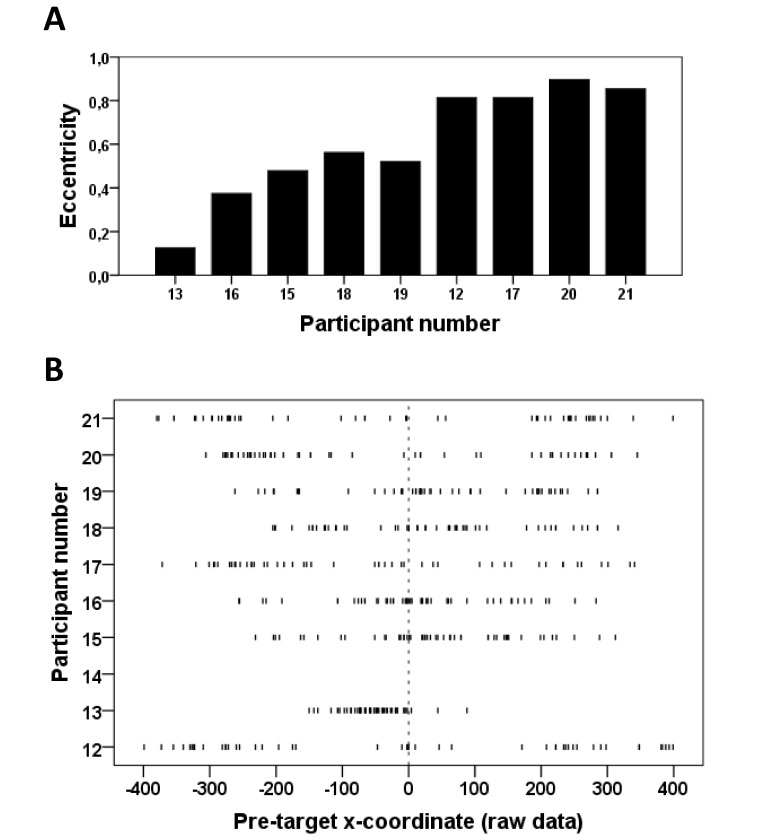
Figure 5.
Section A. Plot of the eccentricity values in the uncertain condition for single participants. Section B. Scatter plot of pre-target x-coordinates for all trials in the uncertain condition for each participant. Each vertical line corresponds to a single trial. Note that the results of Participant number 14 do not appear because he was excluded (see Methods section).

