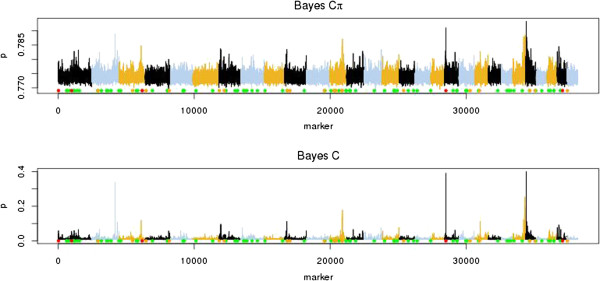
Figure 2.

Posterior inclusion probability (p) across the genome for Bayes Cπ and Bayes C. Scenario with 100 simulated QTL and heritability equal to 0.1; the red, orange and green dots on the x-axes show the true positions of the large, medium, and small simulated QTL, respectively.
