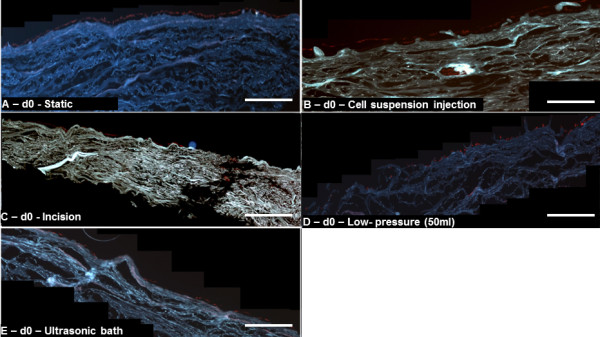
Figure 3.

Representative immunofluorescence cross section images of seeded matrices (blue) after seeding. Fibroblast DNA was stained with PI (red) to visualize the cellular distribution. (A) Static seeding, (E),ultrasonic bath (D) and low pressure (50 ml syringe) resulted in a monolayer of cells on the surface of the scaffold, while (B) cell suspension injection and incision (C) resulted in localized cellular aggregation. Scale bars are equal to 1 mm.
