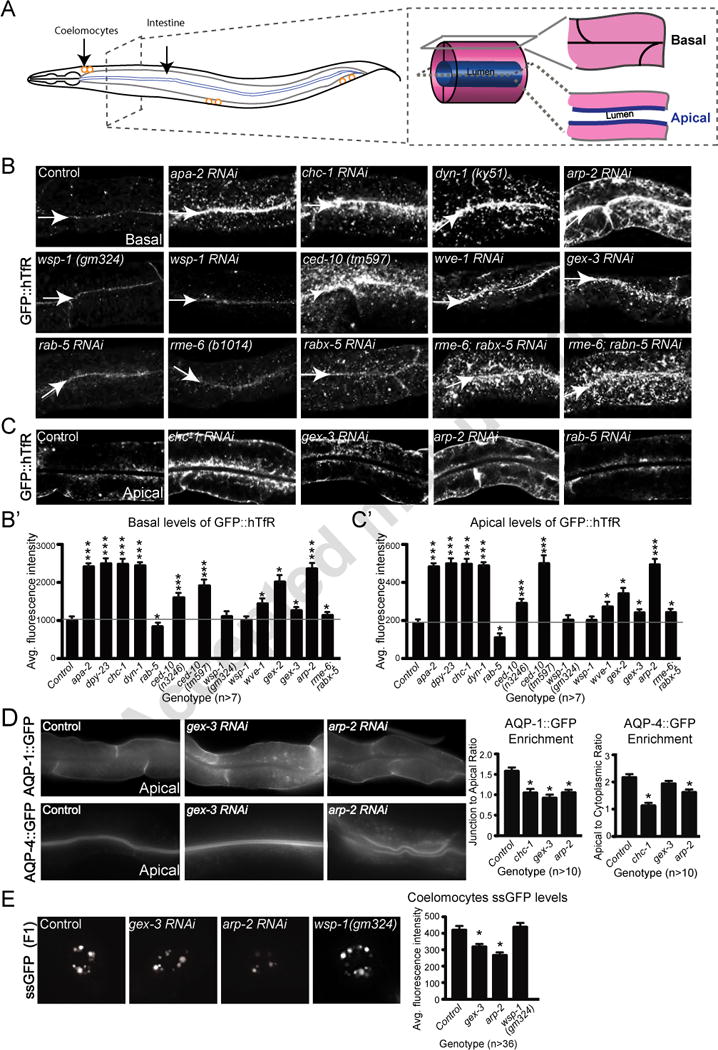
Figure 1. WAVE/SCAR regulates endocytosis in two tissues in C. elegans.

A. The C. elegans adult intestine is a tube made up of only twenty cells, two per segment for most of its length. Basal/surface views are shown in panel B, while apical/center views are shown in panel C. The coelomocyte scavenger cells shown in the myo-3::ssGFP endocytosis assay (Fares and Greenwald, 2001) in panel E, are depicted as three pairs of orange circles.
B. Effects of WAVE/SCAR, ARP-2, Wasp and endocytic proteins on accumulation of the proposed clathrin dependent cargo, GFP::hTfR. Confocal fluorescent images of adult intestinal cells expressing hTfR tagged with GFP, basal focus. Arrows indicate the cell-cell junctions at the basal intestine. Quantification of GFP::hTfR accumulation on the basal side is graphed in B’. For all intestinal images in this and other figures, the same anterior region of the intestine was imaged and is shown.
C. The same animals shown in panel B, apical focus, for a subset of the genotypes. Quantification of GFP::hTfR accumulation on apical side is graphed in C.
D. Effects of WAVE/SCAR and ARP-2 on basally and apically enriched aquaporins. Quantification shows changes in basal and apical distribution of AQP-1 and AQP-4, respectively, two aquaporin channels expressed in the C. elegans intestine (Huang et al., 2007).
E. Effect of gex-3, arp-2 and wsp-1 on endocytosis into coelomocytes. The myo-3::ssGFP endocytosis assay monitors the SEL-1 signal sequence tagged with GFP (ssGFP), produced in the muscles, as it is endocytosed by the coelomocytes. The F2 generation of synchronized L1s fed RNAi (see Methods) was imaged. The graph shows average fluorescence intensity of ssGFP in the coelomocytes (entire cell). Three independent experiments were performed with 12 animals per experiment and genotype. For this and all figures error bars show standard error of the mean (SEM) and “n” equals number of animals for each genotype. Single asterisks indicate statistical significance, p < 0.05, while triple asterisks indicate p < 0.0001. Statistics in all figures performed with Prism software. The horizontal gray line in the large graphs of Figure 1 and 2 are drawn for ease of comparison of wild type to mutants.
