
Figure 4.
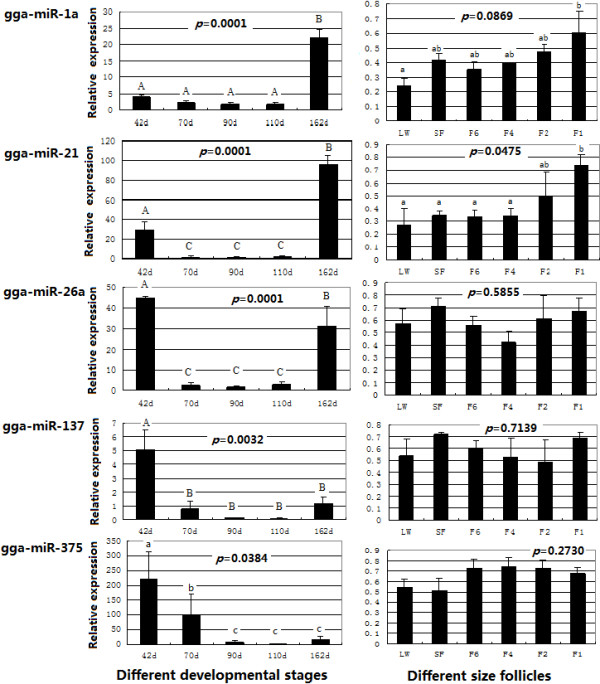
Expression patterns of gga-miR-1a, gga-miR-21, gga-miR-26a, gga-miR-137 and gga-miR-375 in different developmental stages of ovary and in different sized follicle in chicken by qRT-PCR assays. The mean expression value is calculated using 5S rRNA as control, according to the △△Ct method. Error bars represent one standard deviation of three different biological replicates. Statistical significance is reported for each miRNA. a, b and c: P < 0.05; A, B and C: P < 0.01.