
Figure 1.
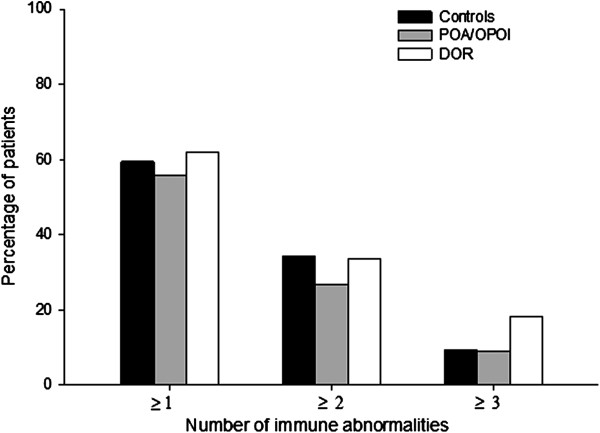
Prevalence of immune abnormalities in investigated patient groups. X-axis demonstrates the number of immune abnormalities per patient (range 1–3). The number of immune abnormalities detected in in controls, POA/OPOI and DOR patients did not differ. Women with DOR, however, demonstrated a trend toward more ≥3 abnormalities in comparison to controls and POA/OPOI patients (P = 0.06), with up to 9 percent difference.