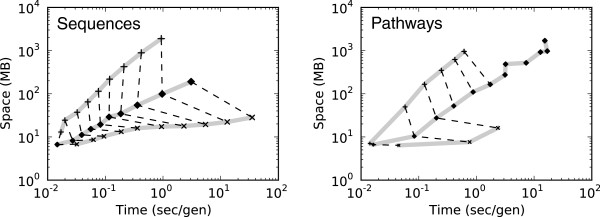
Figure 4.

Space and time performance of compression algorithms. The average time per generation and memory usage required by each compression algorithm for replicate simulations of sequences (left) and pathways (right). For both time – measured in seconds per generation – and space – measured in total MB – lower values are better. The performance is measured across a range of genotype sizes: 105−107 bases for sequences and 100−1,000 genes for pathways. Larger genotypes require more space and longer execution times, hence a diagonal line in the space-time tradeoff. Solid lines connect a compression policy — top to bottom: Store-Active, Greedy-Load, Store-Root — and dashed lines connect genotype sizes (e.g., 105 nt for each policy). Greedy-Load provides 95% compression for sequences and 90% for pathways.
