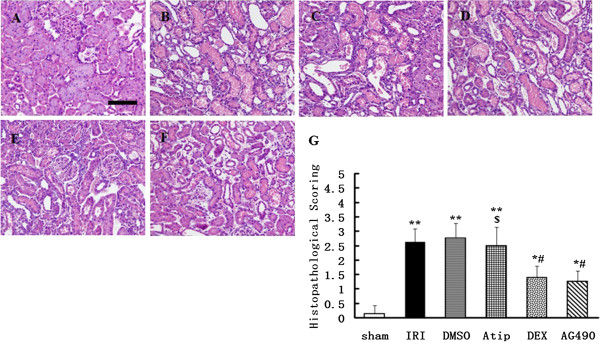
Figure 2.

Effects of dexmedetomidine inhibition on I/R-induced renal injury-histology. Representative microphotographs were taken from the kidneys of the sham (A), IRI (B), DMSO (C), Atip (D), DEX (E) and AG490 (F) groups at the time point of 48 h after renal I/R. Histopathological examination was performed using hematoxylin and eosin. Semi-quantitative assessment of the histological lesions based on tubular necrosis (G). Bar = 50 μm. Data were represented as mean ± SEM (n = 8). *P < 0.05 and **P < 0.01 vs. the sham group. #P < 0.05 vs. the IRI and DMSO groups. $P < 0.05 vs. the DEX group.
