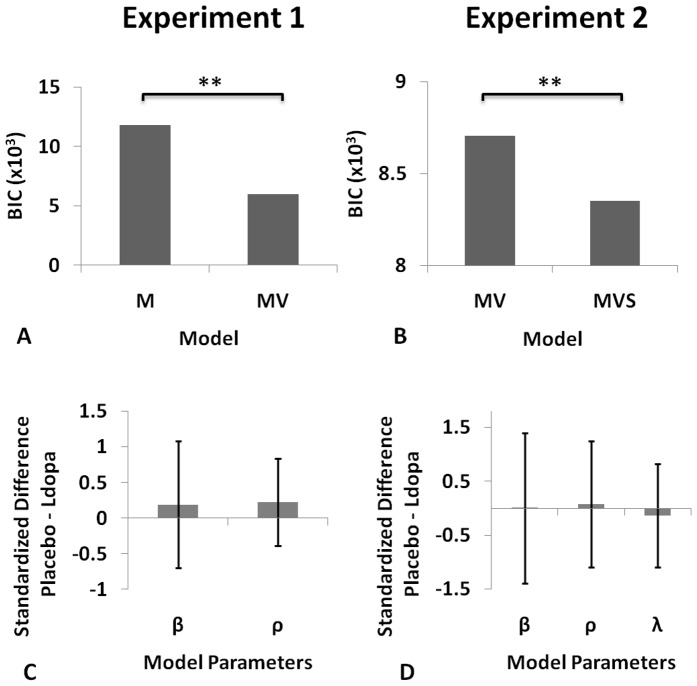
Figure 3. Behavioural modelling.
A. Experiment 1: Log-evidence, approximated by the Bayesian information criterion (BIC), for mean only (M) and mean-variance (MV) models. Fixed effects analysis of Group Bayes Factors shows MV highly significantly superior to M model (likelihood ratio test: p<10−5). B. Experiment 2: BIC scores for mean-variance (MV) and mean-variance-skewness (MVS) models. MVS highly significantly superior to MV model (likelihood ratio test: p<10−5). BIC = k.ln(n) –2ln(L), where L is the model likelihood, n is the number of observations and k is the number of free parameters. Lower BIC indicates better model fit. C. Experiment 1: Differences in (standardised) model parameters for choice noise (β) and variance preference (ρ) between placebo and levodopa sessions. Error bars show standard deviation. D. Experiment 2: Differences in (standardised) model parameters for choice noise (β), variance (ρ), and skewness (λ) preference between placebo and levodopa sessions. Error bars show standard deviation.

