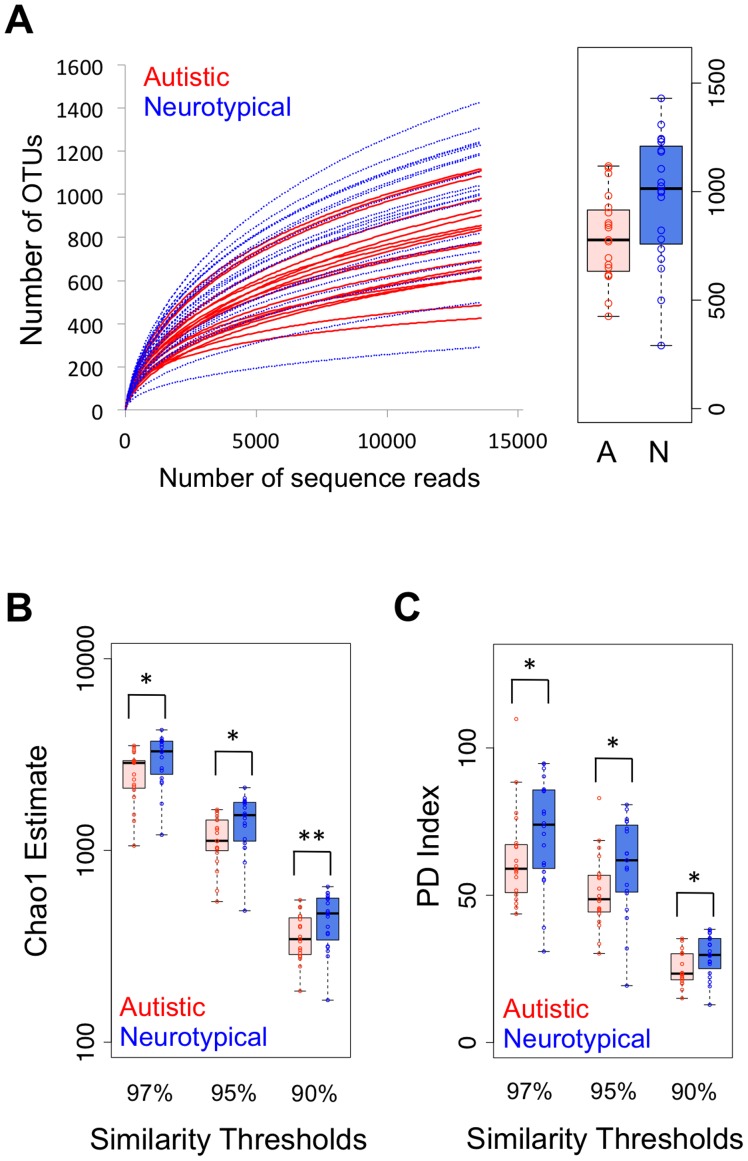
Figure 1. Comparison on bacterial richness and diversity between neurotypical and autistic children.
(A) Rarefaction curves showing unique OTUs at the 95% threshold (a box graph at the rarefied sequence number), comparison of (B) Chao1 estimators and (C) phylogenetic diversity (PD) index between neurotypical (blue-colored box) and autistic (red-colored box) groups at different similarity thresholds (*: P<0.05, **: P<0.01 by one-tailed Mann-Whitney test).

