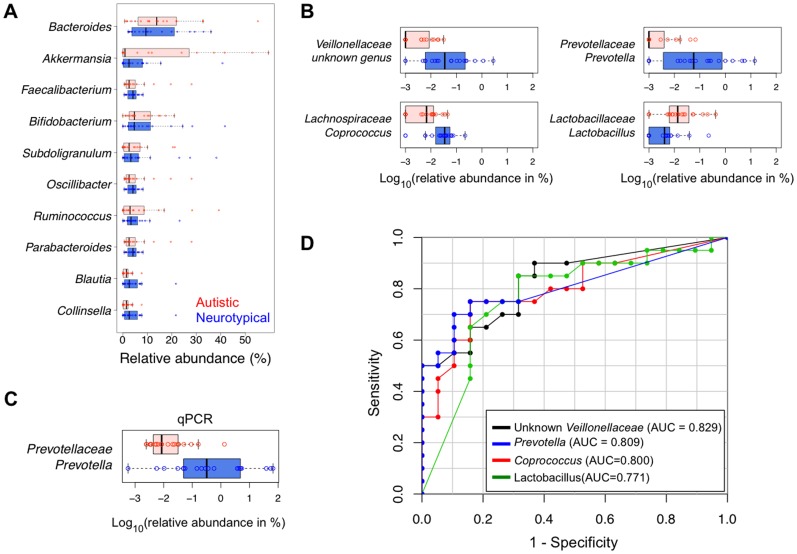
Figure 2. Distribution of 39 subjects based on relative abundance.
(A) The top 10 most abundant genera, (B) 4 most differentially abundant genera (Red-colored box: autistic children, blue-colored box: neurotypical children), (C) the genus Prevotella obtained by qPCR analysis (Red-colored box: autistic children, blue-colored box: neurotypical children), and (D) receiver operating characteristics (ROC) curve of the 4 genera that have the highest area under curve (AUC).

