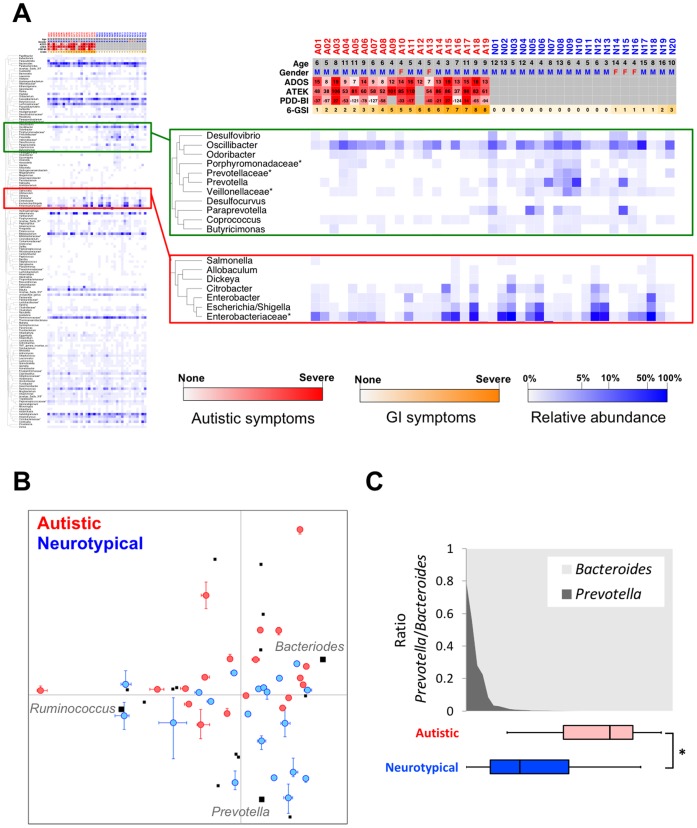
Figure 4. Genus level comparison of gut microbiota between neurotypical and autistic children.
(A) Heat map profile and dendrogram of all identified genera (A01-A19: autistic children, N01–N20: neurotypical children). A red, orange, and blue scale bar represents scores of autistic symptoms, GI problems, and a log scale of the percentile abundance from a total bacteria, respectively. (B) Principal Component Analysis at the genus level from the autistic and neurotypical children. Blue- and red-, and black-colored dots represent neurotypical, autistic samples, and 16 selected genera, respectively. Three genera representing enterotypes (23) were identified in bold. (C) The gradient of Prevotella and Bacteroides through neurotypical and autistic children (*: P<0.05 by Mann-Whitney test).

