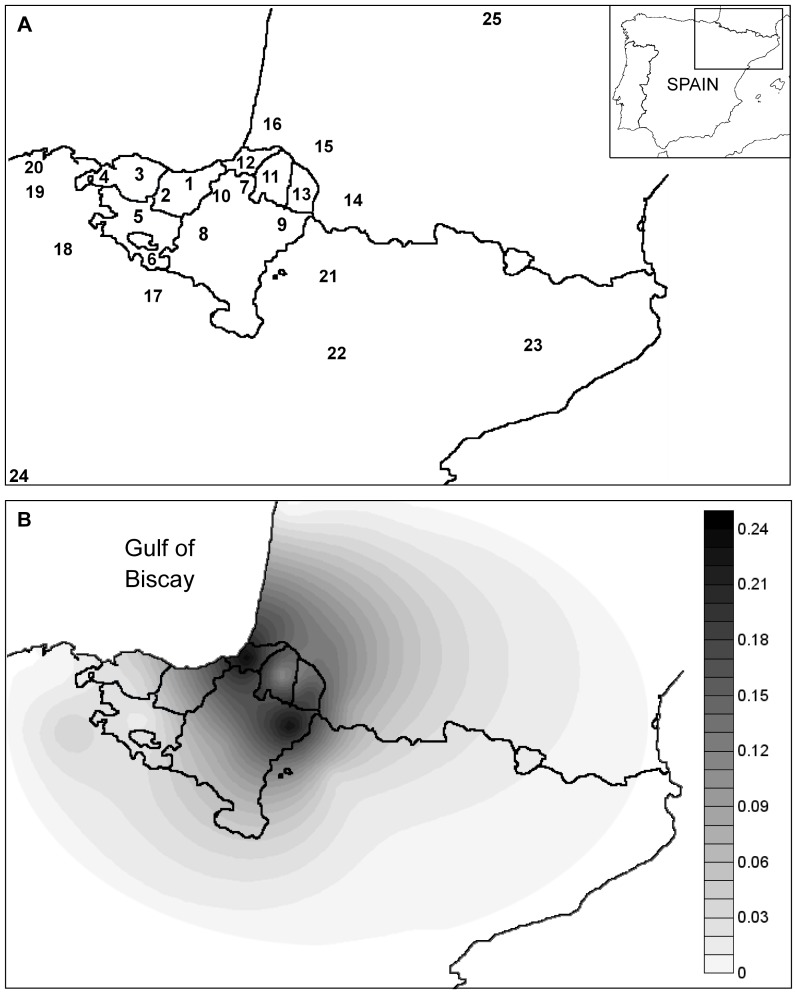
Figure 2. Distribution map of haplogroup U5b1f within the Franco-Cantabrian region.
A) Geographic locations of populations surveyed for haplogroup U5b1f (1. Guipuzcoa, 2. South-West Guipuzcoa, 3. Biscay, 4. West Biscay, 5. Alava, 6. South Alava, 7. Northern Navarre, 8. Central-West Navarre, 9. North-East Navarre, 10. North-West Navarre, 11. Lower Navarre, 12. Labourdin, 13. Soule, 14. Bearn, 15. Bigorre, 16. Chalosse, 17. La Rioja, 18. Burgos, 19. Pas Valley, 20. Cantabria, 21. Aragon, 22. Zaragoza, 23. North-East Spain, 24. Madrid and 25. Périgord-Limousin). Frequency values are shown in Table S3. B) Grayscale represents spatial variation in haplogroup frequency, with a peak between northeastern Navarre and Iparralde (French Basque Country), and a gradual decreasing trend towards the borders of the distribution. In evolutionary terms, differences in grayscale within the same geographic territory (e.g. Basque area) imply local genetic differentiation.

