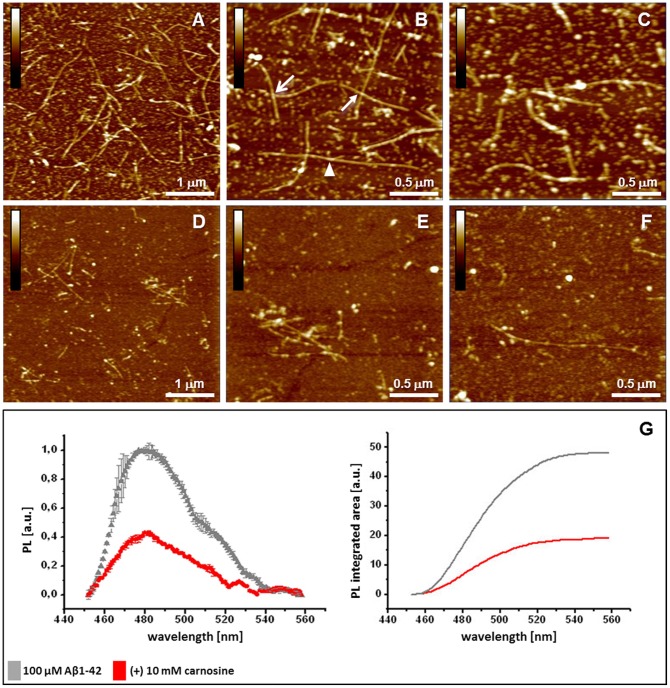
Figure 1. Effects of carnosine on Aβ1-42 fibrillogenesis.
Analysis of the deposited amyloid aggregates as assessed by Atomic Force Microscopy (AFM) and thioflavin T (ThT) assays. AFM pictures (A–F) represent a comparative view of deposited Aβ1-42 amyloid aggregates, with representative fibrils from (A–C) Aβ1-42 samples (control) and (D–F) Aβ1-42/carnosine co-incubated samples. (B, C) Higher resolution images of (A) are reported, showing (B) extended structures of linear branched (arrowhead), overlapped (closed arrow) or associated (open arrow) fibrils; small fibrillar formations and oligomers among globular particles are also observed. (E, F) Higher resolution images of (D) are reported, showing spare fibrils and aggregates with respect to what observed in Aβ1-42 samples; conspicuous fibril segmentation and size reduction were observed [Height mode imaging; Pico Force type scanner; scanned area size: 5×5 µm in (A) and (D) and 2.5×2.5 µm in the others; height bars colour code: 0.0 nm, total black, 15 nm, total white]. (G) Quantitative effects of carnosine on Aβ1-42 fibrillogenesis by ThT assay. Data are expressed as ThT photoluminescence (PL; Y axis) values (means ± SD, n = 3) in solutions of Aβ1-42 (100 µM) incubated for 30 min in the absence (control) and presence of carnosine (10 mM). In the left graph, the maximum photoluminescence intensity (near wavelength 480 nm; X axis) is reduced in the co-incubated samples (red circles) with respect to the samples containing Aβ1-42 alone (grey triangles), passing from 1.0 to ∼ 0.4 absorbance units (a.u.). The emission spectrum of carnosine alone was subtracted, and emission data of peptide dispersions were normalized. In the graph on the right: fluorescence signals expressed as the integrated areas under the curves (OriginPro 8).

