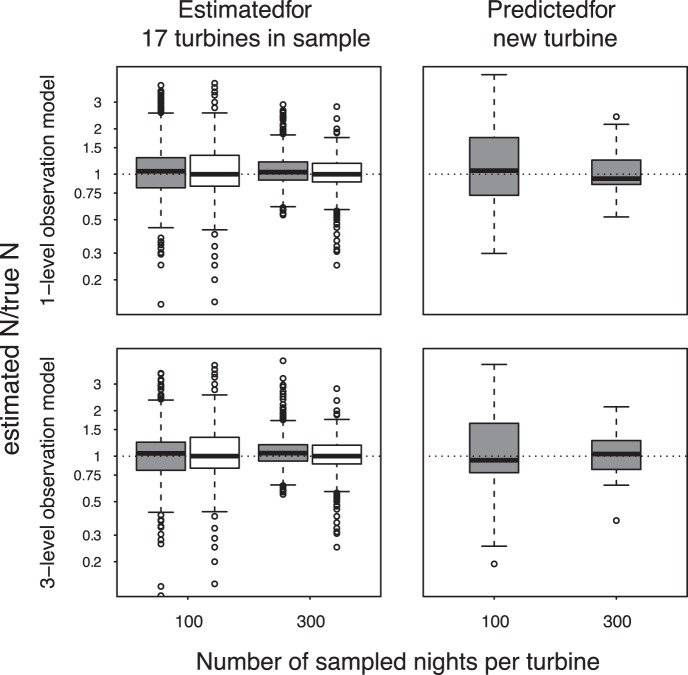
Figure 1. Ratio of the estimated and the true number of collisions per turbine for 50 simulated data sets.
17 turbines were used to fit the model (1700 data points for each box, left panels), collisions were then predicted for a new turbine not used to fit the model (50 data points for each box, right panels). The y-axis is log-scaled so that equivalent proportional increases and decreases result in the same change on the y-axis. Grey boxes indicate model estimates using the one- (upper panels) and three-level (lower panels) observation model (see text). White boxes give the conventional “corrected count” estimates (see text) using only carcass count data and estimates for carcass detection probability. The data has been simulated for two settings with different sample sizes (100 and 300 nights per turbine). The average total numbers of collisions per turbine for these two settings were 4.5 and 14.2 bats respectively. Bold horizontal line = median, box = 50% range of the data, whiskers = last value within 1.5 times the interquartile range, circles = data points further away.

