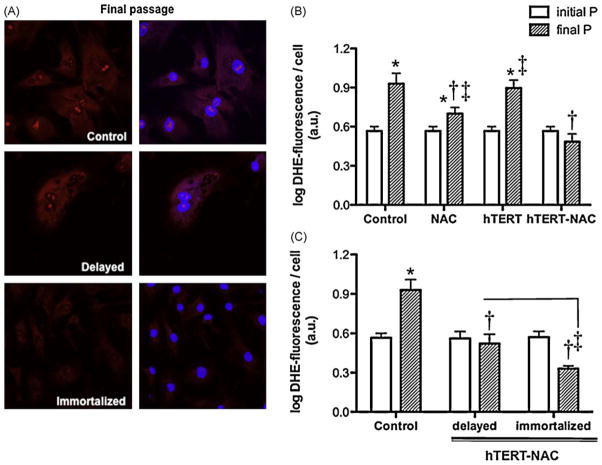
Fig. 5. Combination of NAC and hTERT over-expression decreased of oxidative stress in immortalized EC.
(A) Confocal images of DHE (in red; nuclear counterstaining in blue) at final passage in non-infected EC and in hTERT-NAC EC where senescence was delayed or prevented. (B and C) Nuclear fluorescence intensity (arbitrary units, a.u., corrected by cell number) of DHE, in non-infected EC, NAC-treated, hTERT-infected and hTERT-NAC EC, at initial and final passages (n = 6). (C) Nuclear DHE-fluorescence intensity in non-infected EC and hTERT-NAC EC where senescence was delayed or prevented, at initial and final passages. Data are mean ± SEM of logarithmic transformed values. *: p < 0.05 compared to initial passage; †: p < 0.05 compared to Control; ‡: p < 0.05 compared to hTERT-NAC EC or as indicated. (For interpretation of the references to color in this figure legend, the reader is referred to the web version of the article.)

