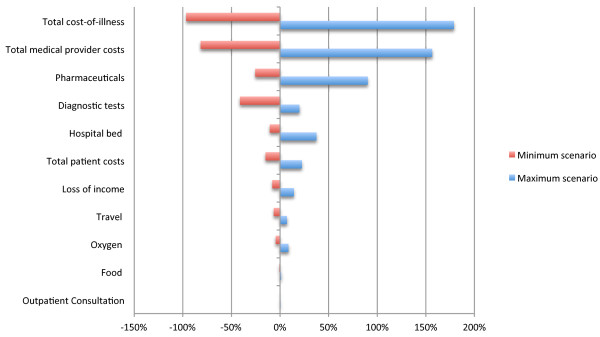
Figure 2.

Sensitivity of cost-of-illness for H5N1 to change in intensity of care (% change in total cost). This tornado diagram was derived from a multi-way sensitivity analysis and illustrates the percentage change in total cost-of-illness when the intensity of care is varied. The baseline is the average COI from the case series. Upper and lower scenarios were developed for the patient care in order to determine the impact on the COI cost centres. The minimum care comparator incudes only outpatient consultation and loss of income due to illness whilst the maximum scenario utilises a full battery of diagnostics and treatment, including a complete adult course of oseltamivir and higher cost of hospitalisation in an intensive care unit.
