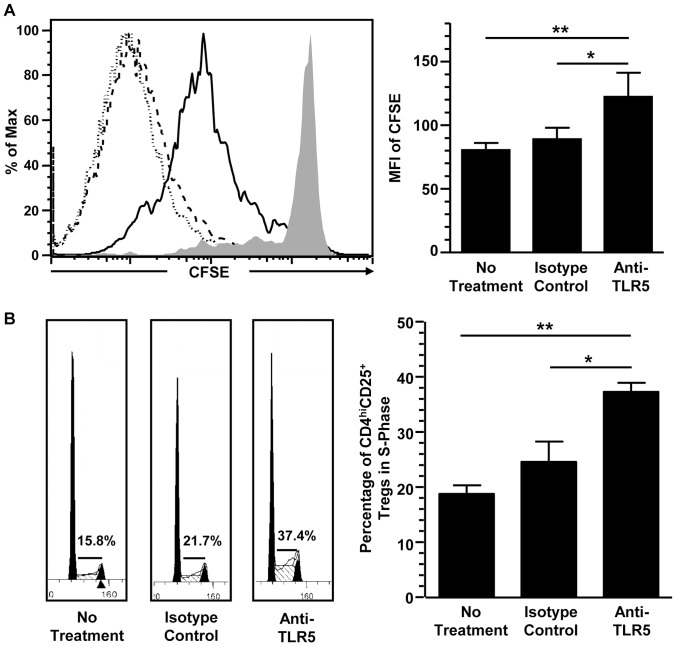
Figure 2. The blockade of TLR5 reduced CD4hiCD25+ regulatory T cells proliferation by inducing S phase arrest.
(A) Flow cytometric analysis of the CFSE signal in CD4hiCD25+ regulatory T cells generated with no treatment (dotted line), with isotype-matched mAb (dashed line), and with anti-TLR5 blocking mAb (solid line). Filled histogram is the CFSE signal on Day 0 (left panel). Statistical analysis of the MFI of the CFSE in CD4hiCD25+ regulatory T cells. Data show Mean+SEM, n = 6. (right panel). (B) Cell cycle analysis of CD4hiCD25+ regulatory T cells generated with no treatment (left), with isotype-matched mAb (middle), and with anti-TLR5 blocking mAb (right). Numbers indicate the percentage of CD4hiCD25+ regulatory T cells in S phase (left panel). Statistical analysis of percentage of CD4hiCD25+ regulatory T cells in S phase. Data show Mean+SEM, n = 6 (right panel). All data shown are representative from three independent experiments. *p<0.05, **p<0.01, one way ANOVA with Tukey’s pairwise comparisons.

